Wells Fargo 2012 Annual Report Download - page 57
Download and view the complete annual report
Please find page 57 of the 2012 Wells Fargo annual report below. You can navigate through the pages in the report by either clicking on the pages listed below, or by using the keyword search tool below to find specific information within the annual report.-
 1
1 -
2
-
3
-
4
-
5
-
6
-
7
-
8
-
9
-
10
-
11
-
12
-
13
-
14
-
15
-
16
-
17
-
18
-
19
-
20
-
21
-
22
-
23
-
24
-
25
-
26
-
27
-
28
-
29
-
30
-
31
-
32
-
33
-
34
-
35
-
36
-
37
-
38
-
39
-
40
-
41
-
42
-
43
-
44
-
45
-
46
-
 47
47 -
 48
48 -
 49
49 -
 50
50 -
 51
51 -
 52
52 -
 53
53 -
 54
54 -
 55
55 -
 56
56 -
 57
57 -
 58
58 -
 59
59 -
 60
60 -
 61
61 -
 62
62 -
 63
63 -
 64
64 -
 65
65 -
 66
66 -
 67
67 -
68
-
69
-
70
-
71
-
72
-
73
-
74
-
75
-
76
-
77
-
78
-
79
-
80
-
81
-
82
-
83
-
84
-
85
-
86
-
87
-
88
-
89
-
90
-
91
-
92
-
93
-
94
-
95
-
96
-
97
-
98
-
99
-
100
-
101
-
102
-
103
-
104
-
105
-
106
-
107
-
108
-
109
-
110
-
111
-
112
-
113
-
114
-
115
-
116
-
117
-
118
-
119
-
120
-
121
-
122
-
123
-
124
-
125
-
126
-
127
-
128
-
129
-
130
-
131
-
132
-
133
-
134
-
135
-
136
-
137
-
138
-
139
-
140
-
141
-
142
-
143
-
144
-
145
-
146
-
147
-
148
-
149
-
150
-
151
-
152
-
153
-
154
-
155
-
156
-
157
-
158
-
159
-
160
-
161
-
162
-
163
-
164
-
165
-
166
-
167
-
168
-
169
-
170
-
171
-
172
-
173
-
174
-
175
-
176
-
177
-
178
-
179
-
180
-
181
-
182
-
183
-
184
-
185
-
186
-
187
-
188
-
189
-
190
-
191
-
192
-
193
-
194
-
195
-
196
-
197
-
198
-
199
-
200
-
201
-
202
-
203
-
204
-
205
-
206
-
207
-
208
-
209
-
210
-
211
-
212
-
213
-
214
-
215
-
216
-
217
-
218
-
219
-
220
-
221
-
222
-
223
-
224
-
225
-
226
-
227
-
228
-
229
-
230
-
231
-
232
-
233
-
234
-
235
-
236
-
237
-
238
-
239
-
240
-
241
-
242
-
243
-
244
-
245
-
246
-
247
-
248
-
249
-
250
-
251
-
252
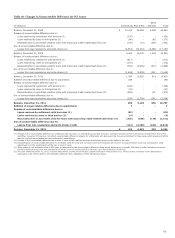
 |
 |

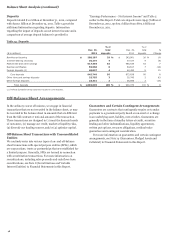
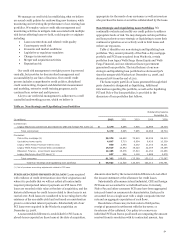
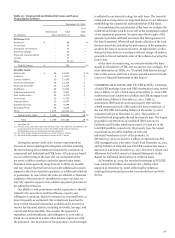
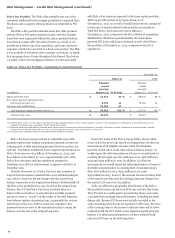
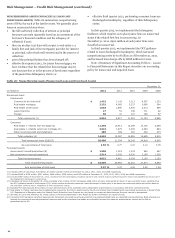
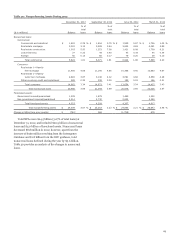
Table 20: Commercial and Industrial Loans and Lease
Financing by Industry
December 31, 2012
% of
Nonaccrual Total total
(in millions) loans portfolio (1) loans
PCI loans (1):
Healthcare $ - 48 * %
Technology - 39 *
Aerospace and defense - 37 *
Home furnishings - 23 *
Steel and metal products - 22 *
Leisure - 17 *
Other - 73 (2) *
Total PCI loans $ - 259 * %
All other loans:
Oil and gas $ 36 13,634 2 %
Investors 2 13,570 2
Cyclical retailers 30 12,459 2
Financial institutions 76 12,228 2
Food and beverage 42 11,804 1
Healthcare 39 10,044 1
Industrial equipment 50 9,941 1
Real estate lessor 32 9,370
1
Technology 20 6,767
*
Transportation 12 6,597
*
Business services 30 5,754
*
Securities firms 65 5,534
*
Other 1,015 82,222 (3) 10
Total all other loans $ 1,449 199,924 25 %
Total $ 1,449 200,183 25 %
* Less than 1%.
(1) For PCI loans, amounts represent carrying value. PCI loans are considered to be
accruing due to the existence of the accretable yield and not based on
consideration given to contractual interest payments.
(2) No other single category had loans in excess of $11.4 million.
(3) No other single category had loans in excess of $4.7 billion.
During the current credit cycle, we have experienced an
increase in loans requiring risk mitigation activities including
the restructuring of loan terms and requests for extensions of
commercial and industrial and CRE loans. All actions are based
on a re-underwriting of the loan and our assessment of the
borrower’s ability to perform under the agreed-upon terms.
Extension terms generally range from six to thirty-six months
and may require that the borrower provide additional economic
support in the form of partial repayment, or additional collateral
or guarantees. In cases where the value of collateral or financial
condition of the borrower is insufficient to repay our loan, we
may rely upon the support of an outside repayment guarantee in
providing the extension.
Our ability to seek performance under a guarantee is directly
related to the guarantor’s creditworthiness, capacity and
willingness to perform, which is evaluated on an annual basis, or
more frequently as warranted. Our evaluation is based on the
most current financial information available and is focused on
various key financial metrics, including net worth, leverage, and
current and future liquidity. We consider the guarantor’s
reputation, creditworthiness, and willingness to work with us
based on our analysis as well as other lenders’ experience with
the guarantor. Our assessment of the guarantor’s credit strength
is reflected in our loan risk ratings for such loans. The loan risk
rating and accruing status are important factors in our allowance
methodology for commercial and industrial and CRE loans.
In considering the accrual status of the loan, we evaluate the
collateral and future cash flows as well as the anticipated support
of any repayment guarantor. In many cases the strength of the
guarantor provides sufficient assurance that full repayment of
the loan is expected. When full and timely collection of the loan
becomes uncertain, including the performance of the guarantor,
we place the loan on nonaccrual status. As appropriate, we also
charge the loan down in accordance with our charge-off policies,
generally to the net realizable value of the collateral securing the
loan, if any.
At the time of restructuring, we evaluate whether the loan
should be classified as a TDR, and account for it accordingly. For
more information on TDRs, see “Troubled Debt Restructurings”
later in this section and Note 6 (Loans and Allowance for Credit
Losses) to Financial Statements in this Report.
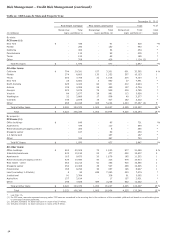
COMMERCIAL REAL ESTATE (CRE) The CRE portfolio, consisting
of both CRE mortgage loans and CRE construction loans, totaled
$123.2 billion, or 15%, of total loans at December 31, 2012. CRE
construction loans totaled $16.9 billion and CRE mortgage loans
totaled $106.3 billion at December 31, 2012. Table 21
summarizes CRE loans by state and property type with the
related nonaccrual totals. CRE nonaccrual loans totaled 4% of
the non-PCI CRE outstanding balance at December 31, 2012
compared with 5% at December 31, 2011. The portfolio is
diversified both geographically and by property type. The largest
geographic concentrations of combined CRE loans are in
California and Florida, which represented 27% and 9% of the
total CRE portfolio, respectively. By property type, the largest
concentrations are office buildings at 26% and
industrial/warehouse at 10% of the portfolio. At
December 31, 2012, we had $17.2 billion of criticized non-PCI
CRE mortgage loans, a decrease of 24% from December 31, 2011,
and $3.8 billion of criticized non-PCI CRE construction loans, a
decrease of 44% from December 31, 2011. See Note 6 (Loans and
Allowance for Credit Losses) to Financial Statements in this
Report for additional information on criticized loans.
At December 31, 2012, the recorded investment in PCI CRE
loans totaled $2.8 billion, down from $12.3 billion when
acquired at December 31, 2008, reflecting the reduction
resulting from principal payments, loan resolutions and write-
downs.
55