Wells Fargo 2012 Annual Report Download - page 207
Download and view the complete annual report
Please find page 207 of the 2012 Wells Fargo annual report below. You can navigate through the pages in the report by either clicking on the pages listed below, or by using the keyword search tool below to find specific information within the annual report.-
 1
1 -
2
-
3
-
4
-
5
-
6
-
7
-
8
-
9
-
10
-
11
-
12
-
13
-
14
-
15
-
16
-
17
-
18
-
19
-
20
-
21
-
22
-
23
-
24
-
25
-
26
-
27
-
28
-
29
-
30
-
31
-
32
-
33
-
34
-
35
-
36
-
37
-
38
-
39
-
40
-
41
-
42
-
43
-
44
-
45
-
46
-
47
-
48
-
49
-
50
-
51
-
52
-
53
-
54
-
55
-
56
-
57
-
58
-
59
-
60
-
61
-
62
-
63
-
64
-
65
-
66
-
67
-
68
-
69
-
70
-
71
-
72
-
73
-
74
-
75
-
76
-
77
-
78
-
79
-
80
-
81
-
82
-
83
-
84
-
85
-
86
-
87
-
88
-
89
-
90
-
91
-
92
-
93
-
94
-
95
-
96
-
97
-
98
-
99
-
100
-
101
-
102
-
103
-
104
-
105
-
106
-
107
-
108
-
109
-
110
-
111
-
112
-
113
-
114
-
115
-
116
-
117
-
118
-
119
-
120
-
121
-
122
-
123
-
124
-
125
-
126
-
127
-
128
-
129
-
130
-
131
-
132
-
133
-
134
-
135
-
136
-
137
-
138
-
139
-
140
-
141
-
142
-
143
-
144
-
145
-
146
-
147
-
148
-
149
-
150
-
151
-
152
-
153
-
154
-
155
-
156
-
157
-
158
-
159
-
160
-
161
-
162
-
163
-
164
-
165
-
166
-
167
-
168
-
169
-
170
-
171
-
172
-
173
-
174
-
175
-
176
-
177
-
178
-
179
-
180
-
181
-
182
-
183
-
184
-
185
-
186
-
187
-
188
-
189
-
190
-
191
-
192
-
193
-
194
-
195
-
196
-
 197
197 -
 198
198 -
 199
199 -
 200
200 -
 201
201 -
 202
202 -
 203
203 -
 204
204 -
 205
205 -
 206
206 -
 207
207 -
 208
208 -
 209
209 -
 210
210 -
 211
211 -
 212
212 -
 213
213 -
 214
214 -
 215
215 -
 216
216 -
 217
217 -
218
-
219
-
220
-
221
-
222
-
223
-
224
-
225
-
226
-
227
-
228
-
229
-
230
-
231
-
232
-
233
-
234
-
235
-
236
-
237
-
238
-
239
-
240
-
241
-
242
-
243
-
244
-
245
-
246
-
247
-
248
-
249
-
250
-
251
-
252
 |
 |

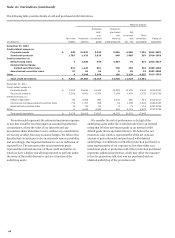
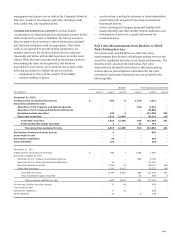
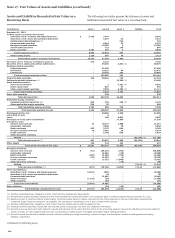
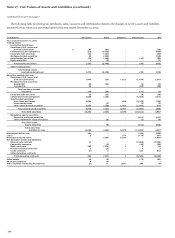
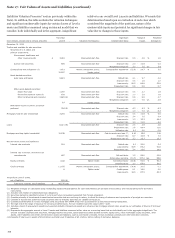
(continued from previous page)
(in millions) Level 1 Level 2 Level 3 Netting Total
December 31, 2011
Trading assets (excluding derivatives)
Securities of U.S. Treasury and federal agencies $ 3,342 3,638 - - 6,980
Securities of U.S. states and political subdivisions - 2,438 53 - 2,491
Collateralized debt obligations (1) - - 1,582 - 1,582
Corporate debt securities - 6,479 97 - 6,576
Mortgage-backed securities - 34,959 108 - 35,067
Asset-backed securities - 1,093 190 - 1,283
Equity securities 1,682 172 4 - 1,858
Total trading securities(2) 5,024 48,779 2,034 - 55,837
Other trading assets 1,847 68 115 - 2,030
Total trading assets (excluding derivatives) 6,871 48,847 2,149 - 57,867
Securities of U.S. Treasury and federal agencies 869 6,099 - - 6,968
Securities of U.S. states and political subdivisions - 21,077 11,516 (3) - 32,593
Mortgage-backed securities:
Federal agencies - 96,754 - - 96,754
Residential - 17,775 61 - 17,836
Commercial - 17,918 232 - 18,150
Total mort
g
a
g
e-backed securities - 132,447 293 - 132,740
Corporate debt securities 317 17,792 295 - 18,404
Collateralized debt obligations (4) - - 8,599 (3) - 8,599
Asset-backed securities:
Auto loans and leases - 86 6,641 (3) - 6,727
Home equity loans - 650 282 - 932
Other asset-backed securities - 8,326 2,863 (3) - 11,189
Total asset-backed securities - 9,062 9,786 - 18,848
Other debt securities - 1,044 - - 1,044
Total debt securities 1,186 187,521 30,489 - 219,196
Marketable equity securities:
Perpetual preferred securities (5) 552 631 1,344 (3) - 2,527
Other marketable equity securities 814 53 23 - 890
Total marketable equity securities 1,366 684 1,367 - 3,417
Total securities available for sale 2,552 188,205 31,856 - 222,613
Mortgages held for sale - 41,381 3,410 - 44,791
Loans held for sale - 1,176 - - 1,176
Loans - 5,893 23 - 5,916
Mortgage servicing rights (residential) - - 12,603 - 12,603
Derivative assets:
Interest rate contracts - 91,022 1,055 - 92,077
Commodity contracts - 4,351 - - 4,351
Equity contracts 471 2,737 560 - 3,768
Foreign exchange contracts 35 4,873 16 - 4,924
Credit contracts - 2,219 1,357 - 3,576
Other derivative contracts - - - - -
Netting - - - (81,143) (6) (81,143)
Total derivative assets (7) 506 105,202 2,988
(
81,143
)
27,553
Other assets 88 135 244 - 467
Total assets recorded at fair value $ 10,017 390,839 53,273
(
81,143
)
372,986
Derivative liabilities:
Interest rate contracts $ (4) (88,164) (446) - (88,614)
Commodity contracts - (4,234) - - (4,234)
Equity contracts (229) (2,797) (635) - (3,661)
Foreign exchange contracts (31)
(
3,324
)
(23) - (3,378)
Credit contracts - (2,099) (3,355) - (5,454)
Other derivative contracts - - (117) - (117)
Netting - - - 89,990 (6) 89,990
Total derivative liabilities (7) (264) (100,618) (4,576) 89,990 (15,468)
Short sale liabilities:
Securities of U.S. Treasury and federal agencies (3,820) (919) - - (4,739)
Securities of U.S. states and political subdivisions - (2) - - (2)
Corporate debt securities - (4,112) - - (4,112)
Equity securities (944)
(
298
)
- - (1,242)
Other securities - (737) - - (737)
Total short sale liabilities (4,764) (6,068) - - (10,832)
Other liabilities - (98) (44) - (142)
Total liabilities recorded at fair value $ (5,028) (106,784) (4,620) 89,990 (26,442)
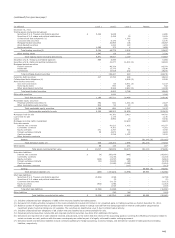
(1) Includes collateralized loan obligations of $583 million that are classified as trading assets.
(2) Net gains from trading activities recognized in the income statement include $133 million in net unrealized gains on trading securities we held at December 31, 2011.
(3) Balances consist of securities that are predominantly investment grade based on ratings received from the ratings agencies or internal credit grades categorized as
investment grade if external ratings are not available. The securities are classified as Level 3 due to limited market activity.
(4) Includes collateralized loan obligations of $8.1 billion that are classified as securities available for sale.
(5) Perpetual preferred securities include ARS and corporate preferred securities. See Note 8 for additional information.
(6) Derivatives are reported net of cash collateral received and paid and, to the extent that the criteria of the accounting guidance covering the offsetting of amounts related to
certain contracts are met, positions with the same counterparty are netted as part of a legally enforceable master netting agreement.
(7) Derivative assets and derivative liabilities include contracts qualifying for hedge accounting, economic hedges, and derivatives included in trading assets and trading
liabilities, respectively.
205