Wells Fargo 2012 Annual Report Download - page 77
Download and view the complete annual report
Please find page 77 of the 2012 Wells Fargo annual report below. You can navigate through the pages in the report by either clicking on the pages listed below, or by using the keyword search tool below to find specific information within the annual report.-
 1
1 -
2
-
3
-
4
-
5
-
6
-
7
-
8
-
9
-
10
-
11
-
12
-
13
-
14
-
15
-
16
-
17
-
18
-
19
-
20
-
21
-
22
-
23
-
24
-
25
-
26
-
27
-
28
-
29
-
30
-
31
-
32
-
33
-
34
-
35
-
36
-
37
-
38
-
39
-
40
-
41
-
42
-
43
-
44
-
45
-
46
-
47
-
48
-
49
-
50
-
51
-
52
-
53
-
54
-
55
-
56
-
57
-
58
-
59
-
60
-
61
-
62
-
63
-
64
-
65
-
66
-
 67
67 -
 68
68 -
 69
69 -
 70
70 -
 71
71 -
 72
72 -
 73
73 -
 74
74 -
 75
75 -
 76
76 -
 77
77 -
 78
78 -
 79
79 -
 80
80 -
 81
81 -
 82
82 -
 83
83 -
 84
84 -
 85
85 -
 86
86 -
 87
87 -
88
-
89
-
90
-
91
-
92
-
93
-
94
-
95
-
96
-
97
-
98
-
99
-
100
-
101
-
102
-
103
-
104
-
105
-
106
-
107
-
108
-
109
-
110
-
111
-
112
-
113
-
114
-
115
-
116
-
117
-
118
-
119
-
120
-
121
-
122
-
123
-
124
-
125
-
126
-
127
-
128
-
129
-
130
-
131
-
132
-
133
-
134
-
135
-
136
-
137
-
138
-
139
-
140
-
141
-
142
-
143
-
144
-
145
-
146
-
147
-
148
-
149
-
150
-
151
-
152
-
153
-
154
-
155
-
156
-
157
-
158
-
159
-
160
-
161
-
162
-
163
-
164
-
165
-
166
-
167
-
168
-
169
-
170
-
171
-
172
-
173
-
174
-
175
-
176
-
177
-
178
-
179
-
180
-
181
-
182
-
183
-
184
-
185
-
186
-
187
-
188
-
189
-
190
-
191
-
192
-
193
-
194
-
195
-
196
-
197
-
198
-
199
-
200
-
201
-
202
-
203
-
204
-
205
-
206
-
207
-
208
-
209
-
210
-
211
-
212
-
213
-
214
-
215
-
216
-
217
-
218
-
219
-
220
-
221
-
222
-
223
-
224
-
225
-
226
-
227
-
228
-
229
-
230
-
231
-
232
-
233
-
234
-
235
-
236
-
237
-
238
-
239
-
240
-
241
-
242
-
243
-
244
-
245
-
246
-
247
-
248
-
249
-
250
-
251
-
252
 |
 |

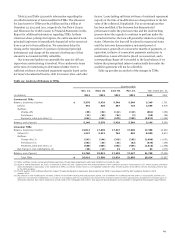
repurchase liability considers all vintages, however, repurchase
demands have predominantly related to 2006 through 2008
vintages and to GSE-guaranteed MBS.
During 2012, we continued to experience elevated levels of
repurchase activity measured by the number of investor
repurchase demands. We repurchased or reimbursed investors
for incurred losses on mortgage loans with original balances of
$2.5 billion in 2012, compared with $2.8 billion in 2011.
Additionally, we negotiated settlements on pools of mortgage
loans with original sold balances of $341 million in 2011, to
eliminate the risk of repurchase on these loans. We had no such
settlements in 2012. We incurred net losses on repurchased
loans and investor reimbursements totalling $1.1 billion in 2012,
compared with $1.2 billion in 2011.
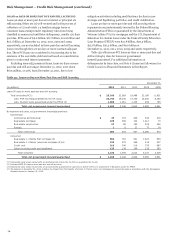
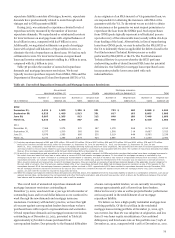
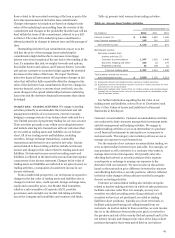
Table 38 provides the number of unresolved repurchase
demands and mortgage insurance rescissions. We do not
typically receive repurchase requests from GNMA, FHA and the
Department of Housing and Urban Development (HUD) or VA.
As an originator of an FHA-insured or VA-guaranteed loan, we
are responsible for obtaining the insurance with FHA or the
guarantee with the VA. To the extent we are not able to obtain
the insurance or the guarantee we must request permission to
repurchase the loan from the GNMA pool. Such repurchases
from GNMA pools typically represent a self-initiated process
upon discovery of the uninsurable loan (usually within 180 days
from funding of the loan). Alternatively, in lieu of repurchasing
loans from GNMA pools, we may be asked by the FHA/HUD or
the VA to indemnify them (as applicable) for defects found in the
Post Endorsement Technical Review process or audits
performed by FHA/HUD or the VA. The Post Endorsement
Technical Review is a process whereby the HUD performs
underwriting audits of closed/insured FHA loans for potential
deficiencies. Our liability for mortgage loan repurchase losses
incorporates probable losses associated with such
indemnification.
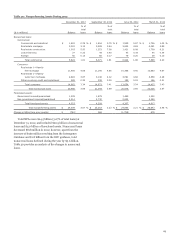
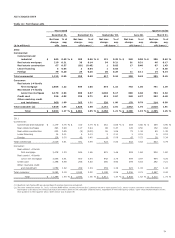
Table 38: Unresolved Repurchase Demands and Mortgage Insurance Rescissions
Government Mortgage insurance
sponsored entities (1) Private rescissions with no demand (2) Total
Number o
f
Original loan Number o
f
Original loan Number o
f
Original loan Number o
f
Original loan
($ in millions) loans balance (3) loans balance (3) loans balance (3) loans balance (3)
2012
December 31, 6,621 $ 1,503 1,306 $ 281 753 $ 160 8,680 $ 1,944
September 30, 6,525 1,489 1,513 331 817 183 8,855 2,003
June 30, 5,687 1,265 913 213 840 188 7,440 1,666
March 31, 6,333 1,398 857 241 970 217 8,160 1,856
2011
December 31, 7,066 1,575 470 167 1,178 268 8,714 2,010
September 30, 6,577 1,500 582 208 1,508 314 8,667 2,022
June 30, 6,876 1,565 695 230 2,019 444 9,590 2,239
March 31, 6,210 1,395 1,973 424 2,885 674 11,068 2,493
(1) Includes repurchase demands of 661 and $132 million, 534 and $111 million, 526 and $103 million, 694 and $131 million, 861 and $161 million, 878 and $173 million,
892 and $179 million and 685 and $132 million for December 31, September 30, June 30 and March 31, 2012, and December 31, September 30, June 30 and
March 31, 2011, respectively, received from investors on mortgage servicing rights acquired from other originators. We generally have the right of recourse against the seller
and may be able to recover losses related to such repurchase demands subject to counterparty risk associated with the seller. The number of repurchase demands from GSEs
that are from mortgage loans originated in 2006 through 2008 totaled 81% at December 31, 2012.
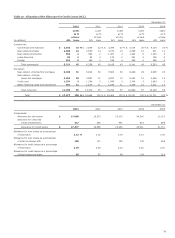
(2) As part of our representations and warranties in our loan sales contracts, we typically represent to GSEs and private investors that certain loans have mortgage insurance to
the extent there are loans that have loan to value ratios in excess of 80% that require mortgage insurance. To the extent the mortgage insurance is rescinded by the
mortgage insurer due to a claim of breach of a contractual representation or warranty, the lack of insurance may result in a repurchase demand from an investor. Similar to
repurchase demands, we evaluate mortgage insurance rescission notices for validity and appeal for reinstatement if the rescission was not based on a contractual breach.
When investor demands are received due to lack of mortgage insurance, they are reported as unresolved repurchase demands based on the applicable investor category for
the loan (GSE or private). Over the last year, approximately 20% of our repurchase demands from GSEs had mortgage insurance rescission as one of the reasons for the
repurchase demand. Of all the mortgage insurance rescission notices received in 2011, approximately 80% have resulted in repurchase demands through December 2012.
Not all mortgage insurance rescissions received as far back as 2011 have been completed through the appeals process with the mortgage insurer and, upon successful
appeal, we work with the investor to rescind the repurchase demand.
(3) While the original loan balances related to these demands are presented above, the establishment of the repurchase liability is based on a combination of factors, such as our
appeals success rates, reimbursement by correspondent and other third party originators, and projected loss severity, which is driven by the difference between the current
loan balance and the estimated collateral value less costs to sell the property.
The overall level of unresolved repurchase demands and
mortgage insurance rescissions outstanding at
December 31, 2012, was down from a year ago in both number of
outstanding loans and in total dollar balances as we continued to
work through the new demands and mortgage insurance
rescissions. Customary with industry practice, we have the right
of recourse against correspondent lenders from whom we have
purchased loans with respect to representations and warranties.
Of total repurchase demands and mortgage insurance recissions
outstanding as of December 31, 2012, presented in Table 38,
approximately 25% relate to loans purchased from
correspondent lenders. Due primarily to the financial difficulties
of some correspondent lenders, we are currently recovering on
average approximately 45% of losses from these lenders.
Historical recovery rates as well as projected lender performance
are incorporated in the establishment of our mortgage
repurchase liability.
We believe we have a high quality residential mortgage loan
servicing portfolio. Of the $1.9 trillion in the residential
mortgage loan servicing portfolio at December 31, 2012, 93%
was current, less than 2% was subprime at origination, and less
than 1% was home equity securitizations. Our combined
delinquency and foreclosure rate on this portfolio was 7.04% at
December 31, 2012, compared with 7.96% at December 31, 2011.
75