Wells Fargo 2012 Annual Report Download - page 160
Download and view the complete annual report
Please find page 160 of the 2012 Wells Fargo annual report below. You can navigate through the pages in the report by either clicking on the pages listed below, or by using the keyword search tool below to find specific information within the annual report.-
 1
1 -
2
-
3
-
4
-
5
-
6
-
7
-
8
-
9
-
10
-
11
-
12
-
13
-
14
-
15
-
16
-
17
-
18
-
19
-
20
-
21
-
22
-
23
-
24
-
25
-
26
-
27
-
28
-
29
-
30
-
31
-
32
-
33
-
34
-
35
-
36
-
37
-
38
-
39
-
40
-
41
-
42
-
43
-
44
-
45
-
46
-
47
-
48
-
49
-
50
-
51
-
52
-
53
-
54
-
55
-
56
-
57
-
58
-
59
-
60
-
61
-
62
-
63
-
64
-
65
-
66
-
67
-
68
-
69
-
70
-
71
-
72
-
73
-
74
-
75
-
76
-
77
-
78
-
79
-
80
-
81
-
82
-
83
-
84
-
85
-
86
-
87
-
88
-
89
-
90
-
91
-
92
-
93
-
94
-
95
-
96
-
97
-
98
-
99
-
100
-
101
-
102
-
103
-
104
-
105
-
106
-
107
-
108
-
109
-
110
-
111
-
112
-
113
-
114
-
115
-
116
-
117
-
118
-
119
-
120
-
121
-
122
-
123
-
124
-
125
-
126
-
127
-
128
-
129
-
130
-
131
-
132
-
133
-
134
-
135
-
136
-
137
-
138
-
139
-
140
-
141
-
142
-
143
-
144
-
145
-
146
-
147
-
148
-
149
-
 150
150 -
 151
151 -
 152
152 -
 153
153 -
 154
154 -
 155
155 -
 156
156 -
 157
157 -
 158
158 -
 159
159 -
 160
160 -
 161
161 -
 162
162 -
 163
163 -
 164
164 -
 165
165 -
 166
166 -
 167
167 -
 168
168 -
 169
169 -
 170
170 -
171
-
172
-
173
-
174
-
175
-
176
-
177
-
178
-
179
-
180
-
181
-
182
-
183
-
184
-
185
-
186
-
187
-
188
-
189
-
190
-
191
-
192
-
193
-
194
-
195
-
196
-
197
-
198
-
199
-
200
-
201
-
202
-
203
-
204
-
205
-
206
-
207
-
208
-
209
-
210
-
211
-
212
-
213
-
214
-
215
-
216
-
217
-
218
-
219
-
220
-
221
-
222
-
223
-
224
-
225
-
226
-
227
-
228
-
229
-
230
-
231
-
232
-
233
-
234
-
235
-
236
-
237
-
238
-
239
-
240
-
241
-
242
-
243
-
244
-
245
-
246
-
247
-
248
-
249
-
250
-
251
-
252
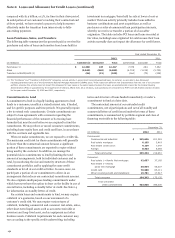
 |
 |

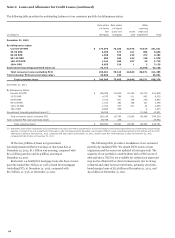
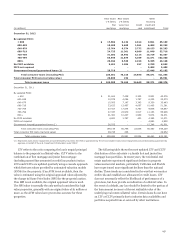
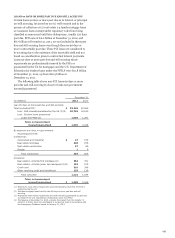
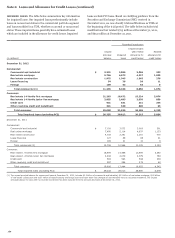
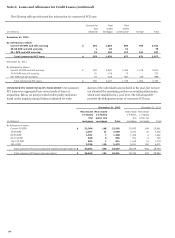
Note 6: Loans and Allowance for Credit Losses (continued)
December 31, 2012 December 31, 2011
Real estate Real estate Real estate Real estate
1-4 family 1-4 family 1-4 family 1-4 family
first junior lien first junior lien
mortgage mortgage mortgage mortgage
(in millions) by LTV by CLTV Total by LTV by CLTV Total
By LTV/CLTV:
0-60% $ 56,247 12,170 68,417 46,476 12,694 59,170
60.01-80% 69,759 15,168 84,927 46,831 15,722 62,553
80.01-100% 34,830 18,038 52,868 36,764 20,290 57,054
100.01-120% (1) 17,004 13,576 30,580 21,116 15,829 36,945
> 120% (1) 13,529 14,610 28,139 18,608 18,626 37,234
No LTV/CLTV available 1,973 1,751 3,724 2,798 2,624 5,422
Government insured/guaranteed loans (2) 29,719 - 29,719 26,555 - 26,555
Total consumer loans (excluding PCI) 223,061 75,313 298,374 199,148 85,785 284,933
Total consumer PCI loans (carrying value) 26,839 152 26,991 29,746 206 29,952
Total consumer loans $ 249,900 75,465 325,365 228,894 85,991 314,885
(1) Reflects total loan balances with LTV/CLTV amounts in excess of 100%. In the event of default, the loss content would generally be limited to only the amount in excess of
100% LTV/CLTV.
(2) Represents loans whose repayments are predominantly insured by the FHA or guaranteed by the VA.
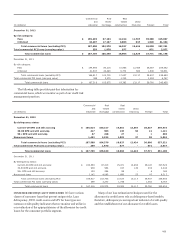
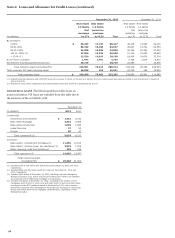
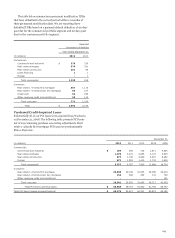
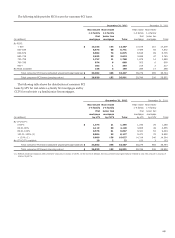
NONACCRUAL LOANS The following table provides loans on
nonaccrual status. PCI loans are excluded from this table due to
the existence of the accretable yield.
December 31,
(in millions) 2012 2011
Commercial:
Commercial and industrial $ 1,422 2,142
Real estate mortgage 3,322 4,085
Real estate construction 1,003 1,890
Lease financing 27 53
Foreign 50 47
Total commercial (1) 5,824 8,217
Consumer:
Real estate 1-4 family first mortgage (2) 11,455 10,913
Real estate 1-4 family junior lien mortgage (3) 2,922 1,975
Other revolving credit and installment 285 199
Total consumer (4) 14,662 13,087
Total nonaccrual loans
(excluding PCI) $ 20,486 21,304
(1) Includes LHFS of $16 million and $25 million at December 31, 2012 and 2011,
respectively.
(2) Includes MHFS of $336 million and $301 million at December 31, 2012 and
2011, respectively.
(3) Includes $960 million at December 31, 2012, resulting from the Interagency
Guidance issued in 2012, which requires performing junior liens to be classified
as nonaccrual if the related first mortgage is nonaccruing.
(4) Includes $1.8 billion at December 31, 2012, consisting of $1.4 billion of first
mortgages, $205 million of junior liens and $140 million of auto and other loans,
resulting from the OCC guidance issued in third quarter 2012, which requires
performing consumer loans discharged in bankruptcy to be placed on nonaccrual
status and written down to net realizable collateral value, regardless of their
delinquency status.
158