Wells Fargo 2012 Annual Report Download - page 206
Download and view the complete annual report
Please find page 206 of the 2012 Wells Fargo annual report below. You can navigate through the pages in the report by either clicking on the pages listed below, or by using the keyword search tool below to find specific information within the annual report.-
 1
1 -
2
-
3
-
4
-
5
-
6
-
7
-
8
-
9
-
10
-
11
-
12
-
13
-
14
-
15
-
16
-
17
-
18
-
19
-
20
-
21
-
22
-
23
-
24
-
25
-
26
-
27
-
28
-
29
-
30
-
31
-
32
-
33
-
34
-
35
-
36
-
37
-
38
-
39
-
40
-
41
-
42
-
43
-
44
-
45
-
46
-
47
-
48
-
49
-
50
-
51
-
52
-
53
-
54
-
55
-
56
-
57
-
58
-
59
-
60
-
61
-
62
-
63
-
64
-
65
-
66
-
67
-
68
-
69
-
70
-
71
-
72
-
73
-
74
-
75
-
76
-
77
-
78
-
79
-
80
-
81
-
82
-
83
-
84
-
85
-
86
-
87
-
88
-
89
-
90
-
91
-
92
-
93
-
94
-
95
-
96
-
97
-
98
-
99
-
100
-
101
-
102
-
103
-
104
-
105
-
106
-
107
-
108
-
109
-
110
-
111
-
112
-
113
-
114
-
115
-
116
-
117
-
118
-
119
-
120
-
121
-
122
-
123
-
124
-
125
-
126
-
127
-
128
-
129
-
130
-
131
-
132
-
133
-
134
-
135
-
136
-
137
-
138
-
139
-
140
-
141
-
142
-
143
-
144
-
145
-
146
-
147
-
148
-
149
-
150
-
151
-
152
-
153
-
154
-
155
-
156
-
157
-
158
-
159
-
160
-
161
-
162
-
163
-
164
-
165
-
166
-
167
-
168
-
169
-
170
-
171
-
172
-
173
-
174
-
175
-
176
-
177
-
178
-
179
-
180
-
181
-
182
-
183
-
184
-
185
-
186
-
187
-
188
-
189
-
190
-
191
-
192
-
193
-
194
-
195
-
 196
196 -
 197
197 -
 198
198 -
 199
199 -
 200
200 -
 201
201 -
 202
202 -
 203
203 -
 204
204 -
 205
205 -
 206
206 -
 207
207 -
 208
208 -
 209
209 -
 210
210 -
 211
211 -
 212
212 -
 213
213 -
 214
214 -
 215
215 -
 216
216 -
217
-
218
-
219
-
220
-
221
-
222
-
223
-
224
-
225
-
226
-
227
-
228
-
229
-
230
-
231
-
232
-
233
-
234
-
235
-
236
-
237
-
238
-
239
-
240
-
241
-
242
-
243
-
244
-
245
-
246
-
247
-
248
-
249
-
250
-
251
-
252
 |
 |

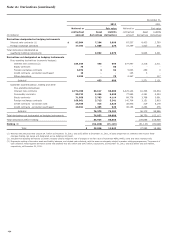
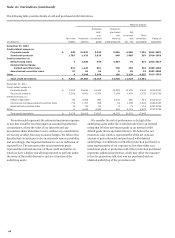
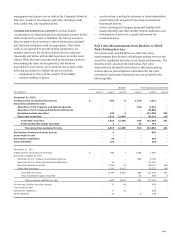
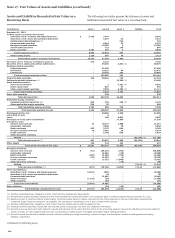
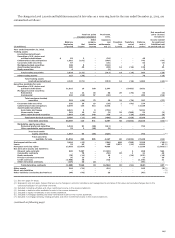
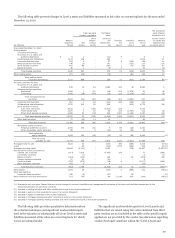
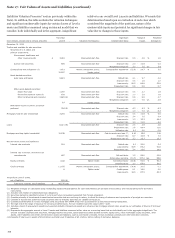
Note 17: Fair Values of Assets and Liabilities (continued)
Assets and Liabilities Recorded at Fair Value on a
Recurring Basis
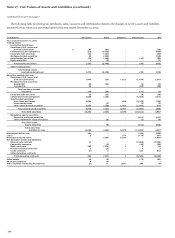
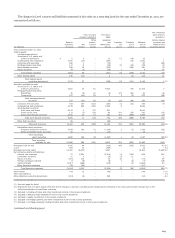
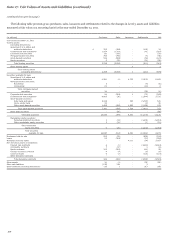
The following two tables present the balances of assets and
liabilities measured at fair value on a recurring basis.
(in millions) Level 1 Level 2 Level 3 Netting Total
December 31, 2012
Trading assets (excluding derivatives)
Securities of U.S. Treasury and federal agencies $ 5,104 3,774 - - 8,878
Securities of U.S. states and political subdivisions - 1,587 46 - 1,633
Collateralized debt obligations (1) - - 742 - 742
Corporate debt securities - 6,664 52 - 6,716
Mortgage-backed securities - 13,380 6 - 13,386
Asset-backed securities - 722 138 - 860
Equity securities 3,481 356 3 - 3,840
Total trading securities(2) 8,585 26,483 987 - 36,055
Other trading assets 2,150 887 76 - 3,113
Total trading assets (excluding derivatives) 10,735 27,370 1,063 - 39,168
Securities of U.S. Treasury and federal agencies 915 6,231 - - 7,146
Securities of U.S. states and political subdivisions - 35,045 3,631 (3) - 38,676
Mortgage-backed securities:
Federal agencies - 97,285 - - 97,285
Residential - 15,837 94 - 15,931
Commercial - 19,765 203 - 19,968
Total mortgage-backed securities - 132,887 297 - 133,184
Corporate debt securities 125 20,934 274 - 21,333
Collateralized debt obligations (4) - - 13,188 (3) - 13,188
Asset-backed securities:
Auto loans and leases - 7 5,921 (3) - 5,928
Home equity loans - 867 51 - 918
Other asset-backed securities - 7,828 3,283 (3) - 11,111
Total asset-backed securities - 8,702 9,255 - 17,957
Other debt securities - 930 - - 930
Total debt securities 1,040 204,729 26,645 - 232,414
Marketable equity securities:
Perpetual preferred securities (5) 629 753 794 (3) - 2,176
Other marketable equity securities 554 55 - - 609
Total marketable equity securities 1,183 808 794 - 2,785
Total securities available for sale 2,223 205,537 27,439 - 235,199
Mortgages held for sale - 39,055 3,250 - 42,305
Loans held for sale - 6 - - 6
Loans - 185 6,021 - 6,206
Mortgage servicing rights (residential) - - 11,538 - 11,538
Derivative assets:
Interest rate contracts 16 70,277 1,058 - 71,351
Commodity contracts - 3,386 70 - 3,456
Equity contracts 432 2,747 604 - 3,783
Foreign exchange contracts 19 5,481 24 - 5,524
Credit contracts - 1,160 650 - 1,810
Other derivative contracts - - - - -
Netting - - - (62,108) (6) (62,108)
Total derivative assets (7) 467 83,051 2,406 (62,108) 23,816
Other assets 136 123 162 - 421
Total assets recorded at fair value $ 13,561 355,327 51,879 (62,108) 358,659
Derivative liabilities:
Interest rate contracts $ (52) (68,244) (399) - (68,695)
Commodity contracts - (3,541) (49) - (3,590)
Equity contracts (199) (3,239) (726) -
(
4,164
)
Foreign exchange contracts (23) (3,553) (3) - (3,579)
Credit contracts - (1,152) (1,800) - (2,952)
Other derivative contracts - - (78) - (78)
Netting - - - 71,116 (6) 71,116
Total derivative liabilities (7) (274) (79,729) (3,055) 71,116 (11,942)
Short sale liabilities:
Securities of U.S. Treasury and federal agencies (4,225) (875) - - (5,100)
Securities of U.S. states and political subdivisions - (9) - - (9)
Corporate debt securities - (3,941) - - (3,941)
Equity securities (1,233) (35) - - (1,268)
Other securities - (47) - - (47)
Total short sale liabilities (5,458) (4,907) - - (10,365)
Other liabilities - (34) (49) - (83)
Total liabilities recorded at fair value $ (5,732) (84,670) (3,104) 71,116 (22,390)
(1) Includes collateralized loan obligations of $721 million that are classified as trading assets.
(2) Net gains from trading activities recognized in the income statement include $305 million in net unrealized gains on trading securities held at December 31, 2012.
(3) Balances consist of securities that are predominantly investment grade based on ratings received from the ratings agencies or internal credit grades categorized as
investment grade if external ratings are not available. The securities are classified as Level 3 due to limited market activity.
(4) Includes collateralized loan obligations of $12.5 billion that are classified as securities available for sale.
(5) Perpetual preferred securities include ARS and corporate preferred securities. See Note 8 for additional information.
(6) Derivatives are reported net of cash collateral received and paid and, to the extent that the criteria of the accounting guidance covering the offsetting of amounts related to
certain contracts are met, positions with the same counterparty are netted as part of a legally enforceable master netting agreement.
(7) Derivative assets and derivative liabilities include contracts qualifying for hedge accounting, economic hedges, and derivatives included in trading assets and trading
liabilities, respectively.
(continued on following page)
204