Wells Fargo 2012 Annual Report Download - page 226
Download and view the complete annual report
Please find page 226 of the 2012 Wells Fargo annual report below. You can navigate through the pages in the report by either clicking on the pages listed below, or by using the keyword search tool below to find specific information within the annual report.-
 1
1 -
2
-
3
-
4
-
5
-
6
-
7
-
8
-
9
-
10
-
11
-
12
-
13
-
14
-
15
-
16
-
17
-
18
-
19
-
20
-
21
-
22
-
23
-
24
-
25
-
26
-
27
-
28
-
29
-
30
-
31
-
32
-
33
-
34
-
35
-
36
-
37
-
38
-
39
-
40
-
41
-
42
-
43
-
44
-
45
-
46
-
47
-
48
-
49
-
50
-
51
-
52
-
53
-
54
-
55
-
56
-
57
-
58
-
59
-
60
-
61
-
62
-
63
-
64
-
65
-
66
-
67
-
68
-
69
-
70
-
71
-
72
-
73
-
74
-
75
-
76
-
77
-
78
-
79
-
80
-
81
-
82
-
83
-
84
-
85
-
86
-
87
-
88
-
89
-
90
-
91
-
92
-
93
-
94
-
95
-
96
-
97
-
98
-
99
-
100
-
101
-
102
-
103
-
104
-
105
-
106
-
107
-
108
-
109
-
110
-
111
-
112
-
113
-
114
-
115
-
116
-
117
-
118
-
119
-
120
-
121
-
122
-
123
-
124
-
125
-
126
-
127
-
128
-
129
-
130
-
131
-
132
-
133
-
134
-
135
-
136
-
137
-
138
-
139
-
140
-
141
-
142
-
143
-
144
-
145
-
146
-
147
-
148
-
149
-
150
-
151
-
152
-
153
-
154
-
155
-
156
-
157
-
158
-
159
-
160
-
161
-
162
-
163
-
164
-
165
-
166
-
167
-
168
-
169
-
170
-
171
-
172
-
173
-
174
-
175
-
176
-
177
-
178
-
179
-
180
-
181
-
182
-
183
-
184
-
185
-
186
-
187
-
188
-
189
-
190
-
191
-
192
-
193
-
194
-
195
-
196
-
197
-
198
-
199
-
200
-
201
-
202
-
203
-
204
-
205
-
206
-
207
-
208
-
209
-
210
-
211
-
212
-
213
-
214
-
215
-
 216
216 -
 217
217 -
 218
218 -
 219
219 -
 220
220 -
 221
221 -
 222
222 -
 223
223 -
 224
224 -
 225
225 -
 226
226 -
 227
227 -
 228
228 -
 229
229 -
 230
230 -
 231
231 -
 232
232 -
 233
233 -
 234
234 -
 235
235 -
 236
236 -
237
-
238
-
239
-
240
-
241
-
242
-
243
-
244
-
245
-
246
-
247
-
248
-
249
-
250
-
251
-
252
 |
 |

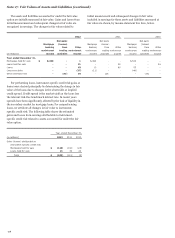
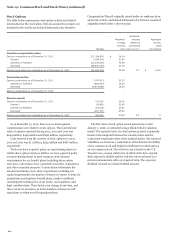
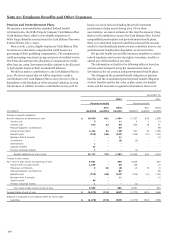
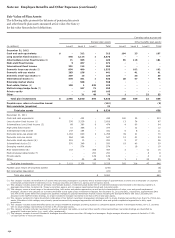
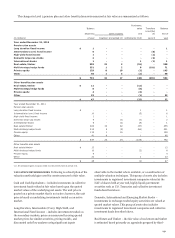
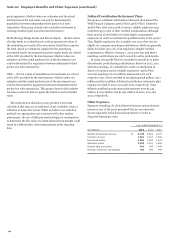
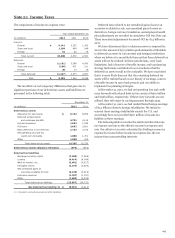
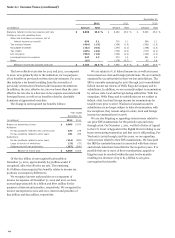
Note 19: Common Stock and Stock Plans (continued)
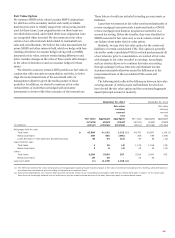
Stock Options
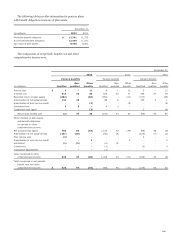
The table below summarizes stock option activity and related
information for the stock plans. Options assumed in mergers are
included in the activity and related information for Incentive
Compensation Plans if originally issued under an employee plan,
and in the activity and related information for Director Awards if
originally issued under a director plan.
Weighted-
Weighted- average Aggregate
average remaining intrinsic
exercise contractual value
Number price term (in yrs.) (in millions)
Incentive compensation plans
Options outstanding as of December 31, 2011 271,298,603 $ 38.14
Granted 1,828,758 31.82
Canceled or forfeited (11,376,806) 73.59
Exercised (58,824,163) 21.78
Options exercisable and outstanding as of December 31, 2012 202,926,392 40.84 3.7 $ 1,119
PartnerShares Plan
Options outstanding as of December 31, 2011 7,477,472 25.25
Canceled or forfeited (606,614) 25.25
Exercised (6,870,858) 25.25
Options outstanding as of December 31, 2012 - - - -
Director awards
Options outstanding as of December 31, 2011 721,432 29.56
Granted 82,893 33.82
Canceled or forfeited (19,232) 33.41
Exercised (197,071) 25.45
Options exercisable and outstanding as of December 31, 2012 588,022 31.42 3.2 2
As of December 31, 2012, there was no unrecognized
compensation cost related to stock options. The total intrinsic
value of options exercised during 2012, 2011 and 2010 was
$694 million, $246 million and $298 million, respectively.
Cash received from the exercise of stock options for 2012,
2011 and 2010 was $1.5 billion, $554 million and $687 million,
respectively.
We do not have a specific policy on repurchasing shares to
satisfy share option exercises. Rather, we have a general policy
on repurchasing shares to meet common stock issuance
requirements for our benefit plans (including share option
exercises), conversion of our convertible securities, acquisitions
and other corporate purposes. Various factors determine the
amount and timing of our share repurchases, including our
capital requirements, the number of shares we expect to issue for
acquisitions and employee benefit plans, market conditions
(including the trading price of our stock), and regulatory and
legal considerations. These factors can change at any time, and
there can be no assurance as to the number of shares we will
repurchase or when we will repurchase them.
The fair value of each option award granted on or after
January 1, 2006, is estimated using a Black-Scholes valuation
model. The expected term of reload options granted is generally
based on the midpoint between the valuation date and the
contractual termination date of the original option. Our expected
volatilities are based on a combination of the historical volatility
of our common stock and implied volatilities for traded options
on our common stock. The risk-free rate is based on the U.S.
Treasury zero-coupon yield curve in effect at the time of grant.
Both expected volatility and the risk-free rates are based on a
period commensurate with our expected term. The expected
dividend is based on a fixed dividend amount.
224