TCF Bank 2010 Annual Report Download - page 96
Download and view the complete annual report
Please find page 96 of the 2010 TCF Bank annual report below. You can navigate through the pages in the report by either clicking on the pages listed below, or by using the keyword search tool below to find specific information within the annual report.-
 1
1 -
2
-
3
-
4
-
5
-
6
-
7
-
8
-
9
-
10
-
11
-
12
-
13
-
14
-
15
-
16
-
17
-
18
-
19
-
20
-
21
-
22
-
23
-
24
-
25
-
26
-
27
-
28
-
29
-
30
-
31
-
32
-
33
-
34
-
35
-
36
-
37
-
38
-
39
-
40
-
41
-
42
-
43
-
44
-
45
-
46
-
47
-
48
-
49
-
50
-
51
-
52
-
53
-
54
-
55
-
56
-
57
-
58
-
59
-
60
-
61
-
62
-
63
-
64
-
65
-
66
-
67
-
68
-
69
-
70
-
71
-
72
-
73
-
74
-
75
-
76
-
77
-
78
-
79
-
80
-
81
-
82
-
83
-
84
-
85
-
 86
86 -
 87
87 -
 88
88 -
 89
89 -
 90
90 -
 91
91 -
 92
92 -
 93
93 -
 94
94 -
 95
95 -
 96
96 -
 97
97 -
 98
98 -
 99
99 -
 100
100 -
 101
101 -
 102
102 -
 103
103 -
 104
104 -
 105
105 -
 106
106 -
107
-
108
-
109
-
110
-
111
-
112
-
113
-
114
-
115
-
116
-
117
-
118
-
119
-
120
-
121
-
122
-
123
-
124
-
125
-
126
-
127
-
128
-
129
-
130
 |
 |

• 80 • TCF Financial Corporation and Subsidiaries
At December 31, 2010, assets held in trust for the Pension Plan included investments in mutual funds and money market
funds. The fair value of these assets is based upon quotes from independent asset pricing services for identical assets
based on active markets, which are considered level 1 under Fair Value Measurements and are measured on a recurring basis.
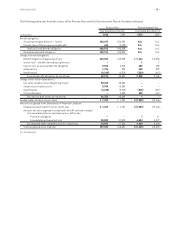
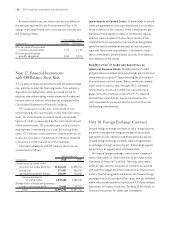
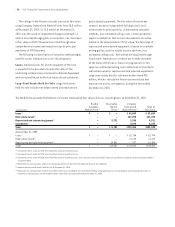
The following table sets forth the changes recognized in accumulated other comprehensive loss at the dates indicated.
Pension Plan Postretirement Plan
Year Ended December 31, Year Ended December 31,
(In thousands) 2010 2009 2008 2010 2009 2008
Accumulated other comprehensive loss
at the beginning of the year $27,020 $ 38,788 $ 7,221 $4,288 $3,652 $4,538
Net actuarial (gain) loss arising
during the period (3,266) (7,495) 33,130 460 892 (492)
Amortizations (recognized in net
periodic benefit cost):
Transition obligation – – – (4) (4) (4)
Actuarial loss (1,595) (1,263) (859) (314) (252) (311)
Settlement expense (2,076) (3,010) (490) – – –
Measurement date change – – (214) – – (79)
Total recognized in other
comprehensive (income) loss (6,937) (11,768) 31,567 142 636 (886)
Accumulated other comprehensive loss
at end of year, before tax $20,083 $ 27,020 $38,788 $4,430 $4,288 $3,652
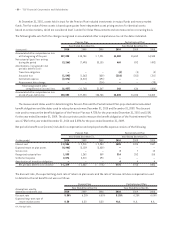
The measurement dates used for determining the Pension Plan and the Postretirement Plan projected and accumulated
benefit obligations and the dates used to value plan assets were December 31, 2010 and December 31, 2009. The discount
rate used to measure the benefit obligation of the Pension Plan was 4.75% for the year ended December 31, 2010 and 5.5%
for the year ended December 31, 2009. The discount rate used to measure the benefit obligation of the Postretirement Plan
was 4.75% for the year ended December 31, 2010 and 5.25% for the year ended December 31, 2009.
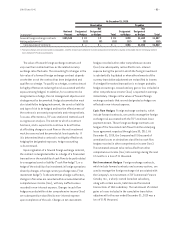
Net periodic benefit cost (income) included in compensation and employee benefits expense consists of the following.
Pension Plan Postretirement Plan
Year Ended December 31, Year Ended December 31,
(In thousands) 2010 2009 2008 2010 2009 2008
Interest cost $ 2,554 $ 2,918 $ 2,934 $455 $495 $537
Expected return on plan assets (4,946) (5,129) (5,059) – – –
Service cost – – – 2 7 12
Recognized actuarial loss 1,595 1,263 859 314 252 310
Settlement expense 2,076 3,010 490 – – –
Amortization of transition obligation – – – 4 4 4
Net periodic benefit cost (income) $ 1,279 $ 2,062 $ (776) $775 $758 $863
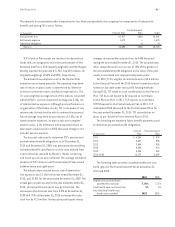
The discount rate, the expected long-term rate of return on plan assets and the rate of increase in future compensation used
to determine the net benefit cost were as follows.
Pension Plan Postretirement Plan
Assumptions used to Year Ended December 31, Year Ended December 31,
determine net benefit cost 2010 2009 2008 2010 2009 2008
Discount rate 5.50% 6.25% 6.00% 5.25% 6.25% 6.00%
Expected long-term rate of
return on plan assets 8.50 8.50 8.50 N.A. N.A. N.A.
N.A. Not Applicable.