TCF Bank 2010 Annual Report Download - page 42
Download and view the complete annual report
Please find page 42 of the 2010 TCF Bank annual report below. You can navigate through the pages in the report by either clicking on the pages listed below, or by using the keyword search tool below to find specific information within the annual report.-
 1
1 -
2
-
3
-
4
-
5
-
6
-
7
-
8
-
9
-
10
-
11
-
12
-
13
-
14
-
15
-
16
-
17
-
18
-
19
-
20
-
21
-
22
-
23
-
24
-
25
-
26
-
27
-
28
-
29
-
30
-
31
-
 32
32 -
 33
33 -
 34
34 -
 35
35 -
 36
36 -
 37
37 -
 38
38 -
 39
39 -
 40
40 -
 41
41 -
 42
42 -
 43
43 -
 44
44 -
 45
45 -
 46
46 -
 47
47 -
 48
48 -
 49
49 -
 50
50 -
 51
51 -
 52
52 -
53
-
54
-
55
-
56
-
57
-
58
-
59
-
60
-
61
-
62
-
63
-
64
-
65
-
66
-
67
-
68
-
69
-
70
-
71
-
72
-
73
-
74
-
75
-
76
-
77
-
78
-
79
-
80
-
81
-
82
-
83
-
84
-
85
-
86
-
87
-
88
-
89
-
90
-
91
-
92
-
93
-
94
-
95
-
96
-
97
-
98
-
99
-
100
-
101
-
102
-
103
-
104
-
105
-
106
-
107
-
108
-
109
-
110
-
111
-
112
-
113
-
114
-
115
-
116
-
117
-
118
-
119
-
120
-
121
-
122
-
123
-
124
-
125
-
126
-
127
-
128
-
129
-
130
 |
 |

• 26 • TCF Financial Corporation and Subsidiaries
finance revenues in 2009 increased $13.6 million, or 24.6%,
from 2008. The increase in leasing and equipment finance
revenues for both years was primarily due to increased
operating lease revenue primarily from the acquisition of
FNCI in 2009, which also had a corresponding increase in
operating lease depreciation of $14.4 million in 2010.
Leasing and equipment finance revenues may fluctuate
from period to period based on customer-driven factors not
within TCF’s control.
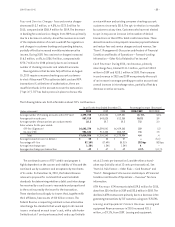
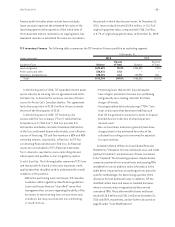
Other Non-Interest Income Total other non-interest income
in 2010 increased $345 thousand from 2009 compared with a
decrease in 2009 of $6.9 million from 2008. The increase from
2009 to 2010 was primarily due to a gain on a non-marketable
investment of $538 thousand. The decrease from 2008 to 2009
was primarily due to TCF no longer selling investment and
insurance products in the branches and a decrease in gains
on the sales of education loans in 2008, partially offset by
servicing fees generated by TCF Inventory Finance.
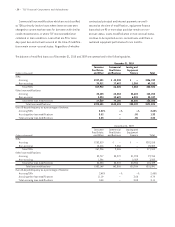
The following table presents the components of other non-interest income.
Compound Annual
Year Ended December 31, Growth Rate
1-Year 5-Year
(Dollars in thousands) 2010 2009 2008 2007 2006 2010/2009 2010/2005
Investments and insurance $1,111 $ 643 $ 9,405 $10,318 $10,695 72.8% (36.4)%
Gains on sales of education loans – – 1,456 2,011 7,224 – (100.0)
Mortgage banking – – – – 4,734 – (100.0)
Other 4,473 4,596 1,246 6,259 9,609 (2.7) (2.5)
Total other earnings $5,584 $5,239 $12,107 $18,588 $32,262 6.6 (24.9)
N.M. Not Meaningful.
Gains on Securities, Net In 2010, TCF recognized net gains of $29.1 million, on of sales of $1.3 billion in mortgage-backed
securities and agency U.S. Treasury Bills and other than temporary losses on certain investments of $2.4 million. In 2009, TCF
recognized net gains of $29.4 million, on sales of $2.1 billion of mortgage-backed securities and agency debentures and U.S.
Treasury Bills and other than temporary losses on certain investments of $2.4 million. In 2008, net gains of $16.1 million were
recognized, which included sales of $1.5 billion in mortgage-backed securities and other than temporary losses on certain
investments of $613 thousand.
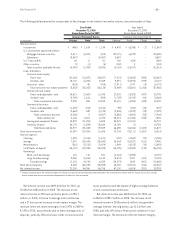
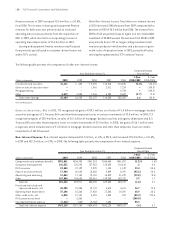
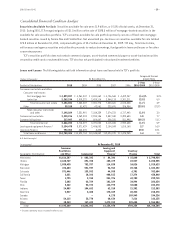
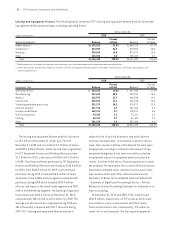
Non-Interest Expense Non-interest expense decreased $4.7 million, or .6%, in 2010, and increased $73.4 million, or 10.6%,
in 2009 and $32.3 million, or 4.9%, in 2008. The following table presents the components of non-interest expense.
Compound Annual
Year Ended December 31, Growth Rate
1-Year 5-Year
(Dollars in thousands) 2010 2009 2008 2007 2006 2010/2009 2010/2005
Compensation and employee benefits $352,861 $356,996 $341,203 $346,468 $341,857 (1.2)% 1.6%
Occupancy and equipment 126,551 126,292 127,953 120,824 114,618 .2 4.0
FDIC insurance 23,584 19,109 2,990 1,145 1,139 23.4 85.3
Deposit account premiums 17,304 30,682 16,888 4,849 5,047 (43.6) 24.3
Advertising and marketing 13,062 17,134 19,150 16,829 21,879 (23.8) (8.0)
Other 147,884 143,698 150,061 139,249 145,732 2.9 1.1
Subtotal 681,246 693,911 658,245 629,364 630,272 (1.8) 2.7
Foreclosed real estate and
repossessed assets, net 40,385 31,886 19,170 5,673 4,181 26.7 72.3
Operating lease depreciation 37,106 22,368 17,458 17,588 14,347 65.9 38.3
Other credit costs, net 6,018 12,137 3,296 1,803 397 (50.4) 172.6
FDIC special assessment – 8,362 – – – (100.0) –
Visa indemnification expense (1,631) (880) (3,766) 7,696 – 85.3 –
Total non-interest expense $763,124 $767,784 $694,403 $662,124 $649,197 (.6) 4.7