TCF Bank 2010 Annual Report Download - page 111
Download and view the complete annual report
Please find page 111 of the 2010 TCF Bank annual report below. You can navigate through the pages in the report by either clicking on the pages listed below, or by using the keyword search tool below to find specific information within the annual report.-
 1
1 -
2
-
3
-
4
-
5
-
6
-
7
-
8
-
9
-
10
-
11
-
12
-
13
-
14
-
15
-
16
-
17
-
18
-
19
-
20
-
21
-
22
-
23
-
24
-
25
-
26
-
27
-
28
-
29
-
30
-
31
-
32
-
33
-
34
-
35
-
36
-
37
-
38
-
39
-
40
-
41
-
42
-
43
-
44
-
45
-
46
-
47
-
48
-
49
-
50
-
51
-
52
-
53
-
54
-
55
-
56
-
57
-
58
-
59
-
60
-
61
-
62
-
63
-
64
-
65
-
66
-
67
-
68
-
69
-
70
-
71
-
72
-
73
-
74
-
75
-
76
-
77
-
78
-
79
-
80
-
81
-
82
-
83
-
84
-
85
-
86
-
87
-
88
-
89
-
90
-
91
-
92
-
93
-
94
-
95
-
96
-
97
-
98
-
99
-
100
-
 101
101 -
 102
102 -
 103
103 -
 104
104 -
 105
105 -
 106
106 -
 107
107 -
 108
108 -
 109
109 -
 110
110 -
 111
111 -
 112
112 -
 113
113 -
 114
114 -
 115
115 -
 116
116 -
 117
117 -
 118
118 -
 119
119 -
 120
120 -
 121
121 -
122
-
123
-
124
-
125
-
126
-
127
-
128
-
129
-
130
 |
 |

• 95 •
2010 Form 10-K
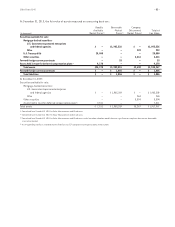
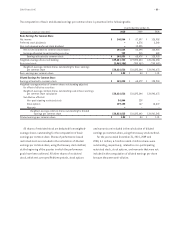
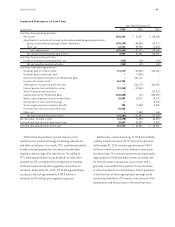
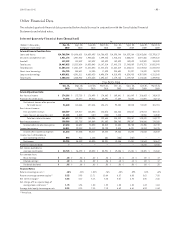
Other Financial Data
The selected quarterly financial data presented below should be read in conjunction with the Consolidated Financial
Statements and related notes.
Selected Quarterly Financial Data (Unaudited)
At
(Dollars in thousands, Dec. 31, Sept. 30, June 30, March 31, Dec. 31, Sept. 30, June 30, March 31,
except per-share data) 2010 2010 2010 2010 2009 2009 2009 2009
Selected Financial Condition Data:
Loans and leases $14,788,304 $14,896,601 $14,639,893 $14,706,423 $14,590,744 $14,329,264 $13,962,656 $13,795,617
Securities available for sale 1,931,174 1,947,462 1,940,331 1,899,825 1,910,476 2,060,227 2,087,406 2,098,628
Goodwill 152,599 152,599 152,599 152,599 152,599 152,599 152,599 152,599
Total assets 18,465,025 18,313,608 18,030,045 18,187,314 17,885,175 17,743,009 17,475,721 18,082,341
Total deposits 11,585,115 11,461,519 11,523,043 11,882,373 11,568,319 11,626,011 11,619,053 11,647,203
Short-term borrowings 126,790 344,681 14,805 17,590 244,604 21,397 25,829 26,299
Long-term borrowings 4,858,821 4,581,511 4,600,820 4,496,574 4,510,895 4,524,955 4,307,098 4,311,568
Total equity 1,480,163 1,505,962 1,474,536 1,393,617 1,179,755 1,179,839 1,142,535 1,499,956
Three Months Ended
Dec. 31, Sept. 30, June 30, March 31, Dec. 31, Sept. 30, June 30, March 31,
2010 2010 2010 2010 2009 2009 2009 2009
Selected Operations Data:
Net interest income $ 174,286 $ 173,755 $ 176,499 $ 174,662 $ 169,641 $ 161,489 $ 156,463 $ 145,413
Provision for credit losses 77,646 59,287 49,013 50,491 77,389 75,544 61,891 43,712
Net interest income after provision
for credit losses 96,640 114,468 127,486 124,171 92,252 85,945 94,572 101,701
Non-interest income:
Fees and other revenue 120,309 129,437 136,043 123,073 135,866 128,057 129,814 102,731
Gains (losses) on securities, net 21,185 8,505 (137) (430) 7,283 – 10,556 11,548
Total non-interest income 141,494 137,942 135,906 122,643 143,149 128,057 140,370 114,279
Non-interest expense 190,500 191,753 189,069 191,802 206,763 190,267 196,546 174,208
Income before income tax expense 47,634 60,657 74,323 55,012 28,638 23,735 38,396 41,772
Income tax expense 16,011 22,852 28,112 20,790 9,385 6,491 14,853 15,125
Income after income tax expense 31,623 37,805 46,211 34,222 19,253 17,244 23,543 26,647
Income (loss) attributable to
non-controlling interest 898 912 1,186 301 (203) (207) – –
Net income 30,725 36,893 45,025 33,921 19,456 17,451 23,543 26,647
Preferred stock dividends – – – – – – 13,218 5,185
Net income available to
common stockholders $ 30,725 $ 36,893 $ 45,025 $ 33,921 $ 19,456 $ 17,451 $ 10,325 $ 21,462
Per common share:
Basic earnings $ .22 $ .26 $ .32 $ .26 $ .15 $ .14 $ .08 $ .17
Diluted earnings $ .22 $ .26 $ .32 $ .26 $ .15 $ .14 $ .08 $ .17
Dividends declared $ .05 $ .05 $ .05 $ .05 $ .05 $ .05 $ .05 $ .25
Financial Ratios:
Return on average assets (1) .68% .84% 1.02% .76% .43% .39% .53% .62%
Return on average common equity (1) 8.25 9.95 12.71 10.68 6.57 6.03 3.61 7.58
Net interest margin (1) 4.04 4.12 4.18 4.20 4.07 3.92 3.80 3.66
Net charge-offs as a percentage of
average loans and leases (1) 1.75 1.58 1.30 1.22 1.35 1.52 1.43 1.04
Average total equity to average assets 8.05 8.28 7.88 7.10 6.69 6.61 6.94 8.64
(1) Annualized.