TCF Bank 2010 Annual Report Download - page 37
Download and view the complete annual report
Please find page 37 of the 2010 TCF Bank annual report below. You can navigate through the pages in the report by either clicking on the pages listed below, or by using the keyword search tool below to find specific information within the annual report.-
 1
1 -
2
-
3
-
4
-
5
-
6
-
7
-
8
-
9
-
10
-
11
-
12
-
13
-
14
-
15
-
16
-
17
-
18
-
19
-
20
-
21
-
22
-
23
-
24
-
25
-
26
-
 27
27 -
 28
28 -
 29
29 -
 30
30 -
 31
31 -
 32
32 -
 33
33 -
 34
34 -
 35
35 -
 36
36 -
 37
37 -
 38
38 -
 39
39 -
 40
40 -
 41
41 -
 42
42 -
 43
43 -
 44
44 -
 45
45 -
 46
46 -
 47
47 -
48
-
49
-
50
-
51
-
52
-
53
-
54
-
55
-
56
-
57
-
58
-
59
-
60
-
61
-
62
-
63
-
64
-
65
-
66
-
67
-
68
-
69
-
70
-
71
-
72
-
73
-
74
-
75
-
76
-
77
-
78
-
79
-
80
-
81
-
82
-
83
-
84
-
85
-
86
-
87
-
88
-
89
-
90
-
91
-
92
-
93
-
94
-
95
-
96
-
97
-
98
-
99
-
100
-
101
-
102
-
103
-
104
-
105
-
106
-
107
-
108
-
109
-
110
-
111
-
112
-
113
-
114
-
115
-
116
-
117
-
118
-
119
-
120
-
121
-
122
-
123
-
124
-
125
-
126
-
127
-
128
-
129
-
130
 |
 |

• 21 •
2010 Form 10-K
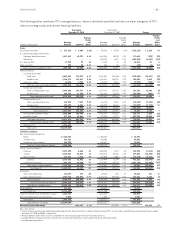
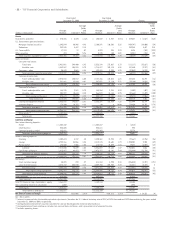
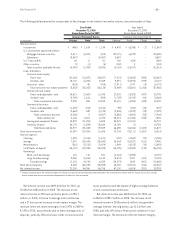
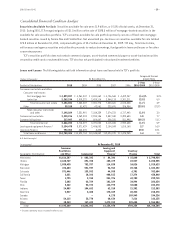
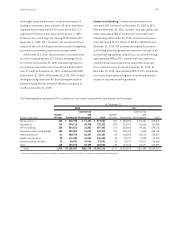
The following tables summarize TCF’s average balances, interest, dividends and yields and rates on major categories of TCF’s
interest-earning assets and interest-bearing liabilities.
Year Ended Year Ended
December 31, 2010 December 31, 2009 Change
Average
Average Average Yields
Yields Yields and
Average and Average and Average Rates
(Dollars in thousands) Balance Interest(1) Rates Balance Interest
(1) Rates Balance Interest(1) (bps)
Assets:
Investments and other $ 337,279 $ 5,509 1.63% $ 375,396 $ 4,370 1.16% $ (38,117) $ 1,139 47
U.S. Government sponsored entities:
Mortgage-backed securities 1,817,413 80,332 4.42 1,645,544 80,902 4.92 171,869 (570) (50)
Debentures – – – 389,245 8,487 2.18 (389,245) (8,487) (218)
U.S. Treasury Bills 71,233 93 .13 17,123 12 .07 54,110 81 6
Other securities 454 20 4.41 494 26 5.26 (40) (6) (85)
Total securities available for sale (2) 1,889,100 80,445 4.26 2,052,406 89,427 4.36 (163,306) (8,982) (10)
Loans and leases:
Consumer real estate:
Fixed-rate 5,082,487 313,573 6.17 5,421,081 348,400 6.43 (338,594) (34,827) (26)
Variable-rate 2,148,171 116,437 5.42 1,862,267 106,988 5.75 285,904 9,449 (33)
Consumer — other 26,576 2,303 8.67 35,849 3,061 8.54 (9,273) (758) 13
Total consumer real estate and other 7,257,234 432,313 5.96 7,319,197 458,449 6.26 (61,963) (26,136) (30)
Commercial real estate:
Fixed- and adjustable-rate 2,816,201 167,757 5.96 2,574,818 155,812 6.05 241,383 11,945 (9)
Variable-rate 495,433 21,559 4.35 561,881 22,544 4.01 (66,448) (985) 34
Total commercial real estate 3,311,634 189,316 5.72 3,136,699 178,356 5.69 174,935 10,960 3
Commercial business:
Fixed- and adjustable-rate 140,498 7,447 5.30 166,745 9,581 5.75 (26,247) (2,134) (45)
Variable-rate 234,892 8,521 3.63 308,929 10,644 3.45 (74,037) (2,123) 18
Total commercial business 375,390 15,968 4.25 475,674 20,225 4.25 (100,284) (4,257) –
Total commercial 3,687,024 205,284 5.57 3,612,373 198,581 5.50 74,651 6,703 7
Leasing and equipment finance 3,056,006 196,445 6.43 2,826,835 192,557 6.81 229,171 3,888 (38)
Inventory finance 677,214 49,881 7.37 179,990 14,797 8.22 497,224 35,084 (85)
Total loans and leases (3) 14,677,478 883,923 6.02 13,938,395 864,384 6.20 739,083 19,539 (18)
Total interest-earning assets 16,903,857 969,877 5.74 16,366,197 958,181 5.85 537,660 11,696 (11)
Other assets (4) 1,286,683 1,157,314 129,369
Total assets $18,190,540 $17,523,511 $ 667,029
Liabilities and Equity:
Non-interest bearing deposits:
Retail $ 1,429,436 $ 1,402,442 $ 26,994
Small business 641,412 584,605 56,807
Commercial and custodial 284,750 265,681 19,069
Total non-interest bearing deposits 2,355,598 2,252,728 102,870
Interest-bearing deposits:
Checking 2,071,990 6,466 .31 1,802,694 8,137 .45 269,296 (1,671) (14)
Savings 5,410,681 40,023 .74 4,732,316 58,556 1.24 678,365 (18,533) (50)
Money market 656,691 4,532 .69 683,030 7,006 1.03 (26,339) (2,474) (34)
Subtotal 8,139,362 51,021 .63 7,218,040 73,699 1.02 921,322 (22,678) (39)
Certificates of deposit 1,054,179 10,208 .97 1,915,467 48,413 2.53 (861,288) (38,205) (156)
Total interest-bearing deposits 9,193,541 61,229 .67 9,133,507 122,112 1.34 60,034 (60,883) (67)
Total deposits 11,549,139 61,229 .53 11,386,235 122,112 1.07 162,904 (60,883) (54)
Borrowings:
Short-term borrowings 124,891 474 .38 85,228 233 .27 39,663 241 11
Long-term borrowings 4,580,786 208,972 4.56 4,373,182 202,830 4.64 207,604 6,142 (8)
Total borrowings 4,705,677 209,446 4.45 4,458,410 203,063 4.55 247,267 6,383 (10)
Total interest-bearing liabilities 13,899,218 270,675 1.95 13,591,917 325,175 2.39 307,301 (54,500) (44)
Total deposits and borrowings 16,254,816 270,675 1.66 15,844,645 325,175 2.05 410,171 (54,500) (39)
Other liabilities 511,589 416,555 95,034
Total liabilities 16,766,405 16,261,200 505,205
Total TCF Financial Corp. stockholders’ equity 1,415,161 1,261,219 153,942
Non-controlling interest in subsidiaries 8,974 1,092 7,882
Total equity 1,424,135 1,262,311 161,824
Total liabilities and equity $18,190,540 $17,523,511 $ 667,029
Net interest income and margin $699,202 4.14% $633,006 3.87% $66,196 27
bps = basis points.
(1) Interest income excludes the taxable equivalent adjustments (based on the U.S. federal statutory rate of 35%) of $1.6 million and $494 thousand during the years ended
December 31, 2010 and 2009, respectively.
(2) Average balance and yield of securities available for sale are based upon the historical amortized cost.
(3) Average balance of loans and leases includes non-accrual loans and leases, and is presented net of unearned income.
(4) Includes operating leases.