TCF Bank 2010 Annual Report Download - page 77
Download and view the complete annual report
Please find page 77 of the 2010 TCF Bank annual report below. You can navigate through the pages in the report by either clicking on the pages listed below, or by using the keyword search tool below to find specific information within the annual report.-
 1
1 -
2
-
3
-
4
-
5
-
6
-
7
-
8
-
9
-
10
-
11
-
12
-
13
-
14
-
15
-
16
-
17
-
18
-
19
-
20
-
21
-
22
-
23
-
24
-
25
-
26
-
27
-
28
-
29
-
30
-
31
-
32
-
33
-
34
-
35
-
36
-
37
-
38
-
39
-
40
-
41
-
42
-
43
-
44
-
45
-
46
-
47
-
48
-
49
-
50
-
51
-
52
-
53
-
54
-
55
-
56
-
57
-
58
-
59
-
60
-
61
-
62
-
63
-
64
-
65
-
66
-
 67
67 -
 68
68 -
 69
69 -
 70
70 -
 71
71 -
 72
72 -
 73
73 -
 74
74 -
 75
75 -
 76
76 -
 77
77 -
 78
78 -
 79
79 -
 80
80 -
 81
81 -
 82
82 -
 83
83 -
 84
84 -
 85
85 -
 86
86 -
 87
87 -
88
-
89
-
90
-
91
-
92
-
93
-
94
-
95
-
96
-
97
-
98
-
99
-
100
-
101
-
102
-
103
-
104
-
105
-
106
-
107
-
108
-
109
-
110
-
111
-
112
-
113
-
114
-
115
-
116
-
117
-
118
-
119
-
120
-
121
-
122
-
123
-
124
-
125
-
126
-
127
-
128
-
129
-
130
 |
 |

• 61 •
2010 Form 10-K
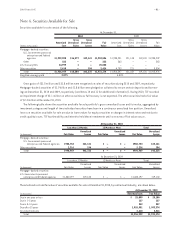
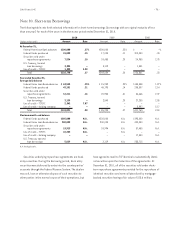
Note 4. Securities Available for Sale
Securities available for sale consist of the following.
At December 31,
2010 2009
Gross Gross Gross Gross
Amortized Unrealized Unrealized Fair Amortized Unrealized Unrealized Fair
(Dollars in thousands) Cost Gains Losses Value Cost Gains Losses Value
Mortgage-backed securities:
U.S. Government sponsored
enterprises and federal
agencies $1,929,098 $16,579 $42,141 $1,903,536 $1,903,201 $21,138 $19,130 $1,905,209
Other 222 – – 222 263 – – 263
U.S. Treasury Bills 24,999 1 – 25,000 – – – –
Other securities 2,610 – 194 2,416 4,783 221 – 5,004
Total $1,956,929 $16,580 $42,335 $1,931,174 $1,908,247 $21,359 $19,130 $1,910,476
Weighted-average yield 3.87% 4.54%
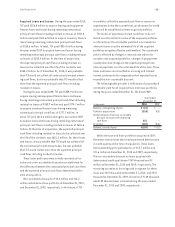
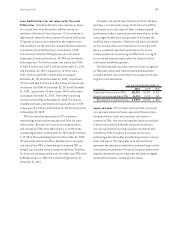
Gross gains of $31.5 million and $31.8 million were recognized on sales of securities during 2010 and 2009, respectively.
Mortgage-backed securities of $1.9 billion and $1.8 billion were pledged as collateral to secure certain deposits and borrow-
ings at December 31, 2010 and 2009, respectively (see Notes 10 and 11 for additional information). During 2010, TCF recorded
an impairment charge of $2.1 million on other securities as full recovery is not expected. The other securities had a fair value
of $2.4 million at December 31, 2010.
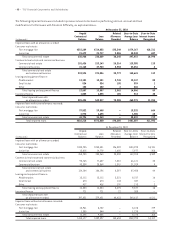
The following table shows the securities available for sale portfolio’s gross unrealized losses and fair value, aggregated by
investment category and length of time individual securities have been in a continuous unrealized loss position. Unrealized
losses on securities available for sale are due to lower values for equity securities or changes in interest rates and not due to
credit quality issues. TCF has the ability and intent to hold these investments until a recovery of fair value occurs.
At December 31, 2010
Less than 12 Months 12 Months or More Total
Unrealized Unrealized Unrealized
(In thousands) Fair Value Losses Fair Value Losses Fair Value Losses
Mortgage-backed securities:
U.S. Government sponsored
enterprises and federal agencies $988,753 $42,141 $ – $ – $988,753 $42,141
Other securities 2,216 194 – – 2,216 194
Total $990,969 $42,335 $ – $ – $990,969 $42,335
At December 31, 2009
Less than 12 Months 12 Months or More Total
Unrealized Unrealized Unrealized
(In thousands) Fair Value Losses Fair Value Losses Fair Value Losses
Mortgage-backed securities:
U.S. Government sponsored
enterprises and federal agencies $1,082,197 $19,130 $ – $ – $1,082,197 $19,130
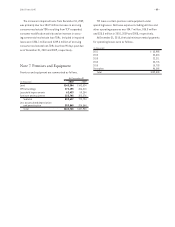
The amortized cost and fair value of securities available for sale at December 31, 2010, by contractual maturity, are shown below.
At December 31, 2010
(In thousands) Amortized Cost Fair Value
Due in one year or less $ 25,099 $ 25,100
Due in 1-5 years 127 127
Due in 5-10 years 342 357
Due after 10 years 1,928,951 1,903,374
No stated maturity 2,410 2,216
Total $1,956,929 $1,931,174