TCF Bank 2010 Annual Report Download - page 92
Download and view the complete annual report
Please find page 92 of the 2010 TCF Bank annual report below. You can navigate through the pages in the report by either clicking on the pages listed below, or by using the keyword search tool below to find specific information within the annual report.-
 1
1 -
2
-
3
-
4
-
5
-
6
-
7
-
8
-
9
-
10
-
11
-
12
-
13
-
14
-
15
-
16
-
17
-
18
-
19
-
20
-
21
-
22
-
23
-
24
-
25
-
26
-
27
-
28
-
29
-
30
-
31
-
32
-
33
-
34
-
35
-
36
-
37
-
38
-
39
-
40
-
41
-
42
-
43
-
44
-
45
-
46
-
47
-
48
-
49
-
50
-
51
-
52
-
53
-
54
-
55
-
56
-
57
-
58
-
59
-
60
-
61
-
62
-
63
-
64
-
65
-
66
-
67
-
68
-
69
-
70
-
71
-
72
-
73
-
74
-
75
-
76
-
77
-
78
-
79
-
80
-
81
-
 82
82 -
 83
83 -
 84
84 -
 85
85 -
 86
86 -
 87
87 -
 88
88 -
 89
89 -
 90
90 -
 91
91 -
 92
92 -
 93
93 -
 94
94 -
 95
95 -
 96
96 -
 97
97 -
 98
98 -
 99
99 -
 100
100 -
 101
101 -
 102
102 -
103
-
104
-
105
-
106
-
107
-
108
-
109
-
110
-
111
-
112
-
113
-
114
-
115
-
116
-
117
-
118
-
119
-
120
-
121
-
122
-
123
-
124
-
125
-
126
-
127
-
128
-
129
-
130
 |
 |
• 76 • TCF Financial Corporation and Subsidiaries
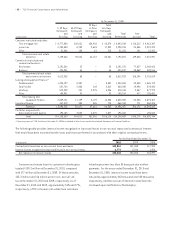
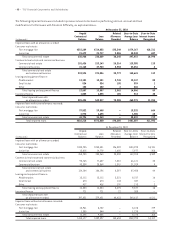
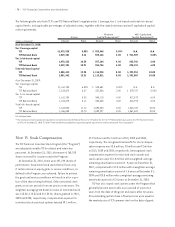
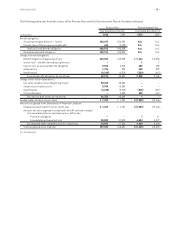
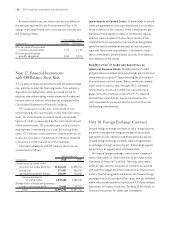
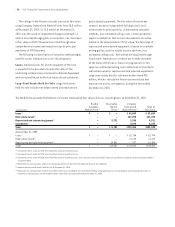
The following table sets forth TCF’s and TCF National Bank’s regulatory tier 1 leverage, tier 1 risk-based and total risk-based
capital levels, and applicable percentages of adjusted assets, together with the stated minimum and well-capitalized capital
ratio requirements.
Minimum Well-Capitalized
Actual Capital Requirement(1) Capital Requirement(1)
(Dollars in thousands) Amount Ratio Amount Ratio Amount Ratio
As of December 31, 2010:
Tier 1 leverage capital
TCF $1,475,525 8.00% $ 553,448 3.00% N.A. N.A.
TCF National Bank 1,519,201 8.24 553,146 3.00 $ 921,909 5.00%
Tier 1 risk-based capital
TCF 1,475,525 10.59 557,164 4.00 835,746 6.00
TCF National Bank 1,519,201 10.91 556,756 4.00 835,133 6.00
Total risk-based capital
TCF 1,808,412 12.98 1,114,328 8.00 1,392,910 10.00
TCF National Bank 1,851,962 13.31 1,113,511 8.00 1,391,889 10.00
As of December 31, 2009:
Tier 1 leverage capital
TCF $1,161,750 6.59% $ 528,681 3.00% N.A. N.A.
TCF National Bank 1,103,875 6.27 527,836 3.00 $ 879,727 5.00%
Tier 1 risk-based capital
TCF 1,161,750 8.52 545,115 4.00 817,672 6.00
TCF National Bank 1,103,875 8.11 544,648 4.00 816,972 6.00
Total risk-based capital
TCF 1,514,940 11.12 1,090,230 8.00 1,362,787 10.00
TCF National Bank 1,456,858 10.70 1,089,297 8.00 1,361,621 10.00
N.A. Not Applicable.
(1) The minimum and well capitalized requirements are determined by the Federal Reserve for TCF and by the OCC for TCF National Bank pursuant to the FDIC Improvement Act
of 1991. At December 31, 2010, TCF and TCF National Bank exceeded their regulatory capital requirements and are considered “well-capitalized”.
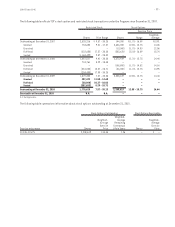
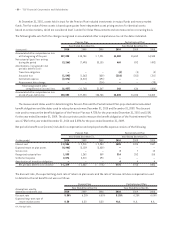
Note 15. Stock Compensation
The TCF Financial Incentive Stock Program (the “Program”)
was adopted to enable TCF to attract and retain key
personnel. At December 31, 2010, there were 4,760,019
shares reserved for issuance under the Program.
At December 31, 2010, there were 207,194 shares of
performance-based restricted stock that will vest only
if certain return on equity goals or service conditions, as
defined in the Program, are achieved. Failure to achieve
the goals and service conditions will result in all or a por-
tion of the shares being forfeited. Other restricted stock
grants vest over periods from one year to seven years. The
weighted-average grant date fair value of restricted stock
was $13.36, $10.33 and $12.50 for shares granted in 2010,
2009 and 2008, respectively. Compensation expense for
restricted stock and stock options totaled $9.1 million,
$7.9 million and $5.7 million in 2010, 2009 and 2008,
respectively. The recognized tax benefit for stock compen-
sation expense was $3.5 million, $3 million and $2 million
in 2010, 2009 and 2008, respectively. Unrecognized stock
compensation expense for restricted stock awards and
stock options were $12.4 million with a weighted-average
remaining amortization period of .9 years at December 31,
2010, compared with $17.3 million with a weighted-average
remaining amortization period of 1.6 years at December 31,
2009 and $20.8 million with a weighted-average remaining
amortization period of 2.4 years at December 31, 2008.
TCF has also issued stock options under the Program that
generally become exercisable over a period of one to ten
years from the date of the grant and expire after ten years.
All outstanding options have a fixed exercise price equal to
the market price of TCF common stock on the date of grant.