TCF Bank 2010 Annual Report Download - page 70
Download and view the complete annual report
Please find page 70 of the 2010 TCF Bank annual report below. You can navigate through the pages in the report by either clicking on the pages listed below, or by using the keyword search tool below to find specific information within the annual report.-
 1
1 -
2
-
3
-
4
-
5
-
6
-
7
-
8
-
9
-
10
-
11
-
12
-
13
-
14
-
15
-
16
-
17
-
18
-
19
-
20
-
21
-
22
-
23
-
24
-
25
-
26
-
27
-
28
-
29
-
30
-
31
-
32
-
33
-
34
-
35
-
36
-
37
-
38
-
39
-
40
-
41
-
42
-
43
-
44
-
45
-
46
-
47
-
48
-
49
-
50
-
51
-
52
-
53
-
54
-
55
-
56
-
57
-
58
-
59
-
 60
60 -
 61
61 -
 62
62 -
 63
63 -
 64
64 -
 65
65 -
 66
66 -
 67
67 -
 68
68 -
 69
69 -
 70
70 -
 71
71 -
 72
72 -
 73
73 -
 74
74 -
 75
75 -
 76
76 -
 77
77 -
 78
78 -
 79
79 -
 80
80 -
81
-
82
-
83
-
84
-
85
-
86
-
87
-
88
-
89
-
90
-
91
-
92
-
93
-
94
-
95
-
96
-
97
-
98
-
99
-
100
-
101
-
102
-
103
-
104
-
105
-
106
-
107
-
108
-
109
-
110
-
111
-
112
-
113
-
114
-
115
-
116
-
117
-
118
-
119
-
120
-
121
-
122
-
123
-
124
-
125
-
126
-
127
-
128
-
129
-
130
 |
 |

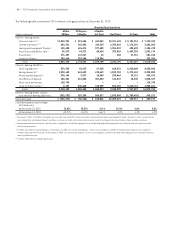
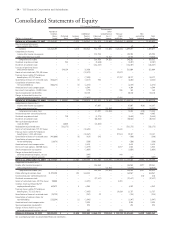
• 54 • TCF Financial Corporation and Subsidiaries
Consolidated Statements of Equity
TCF Financial Corporation
Accumulated
Number of Other
Common Additional Comprehensive Treasury Non-
Shares Preferred Common Paid-in Retained (Loss)/ Stock controlling Total
(Dollars in thousands) Issued Stock Stock Capital Earnings Income and Other Total Interests Equity
Balance as of December 31, 2007 131,468,699 $ – $1,315 $354,563 $ 926,875 $ (18,055) $(165,686) $ 1,099,012 $ – $ 1,099,012
Pension and postretirement
measurement date change – – – – 65 – – 65 – 65
Subtotal 131,468,699 – 1,315 354,563 926,940 (18,055) (165,686) 1,099,077 – 1,099,077
Comprehensive income:
Income after income tax expense – – – – 128,958 – – 128,958 – 128,958
Other comprehensive income – – – – – 14,363 – 14,363 – 14,363
Comprehensive income – – – – 128,958 14,363 – 143,321 – 143,321
Dividends on preferred stock – 283 – – (2,540) – – (2,257) – (2,257)
Dividends on common stock – – – – (126,447) – – (126,447) – (126,447)
Issuance of preferred shares
and common warrant – 348,154 – 12,850 – – – 361,004 – 361,004
Grants of restricted stock, 755,838 shares – – – (19,573) – – 19,573 – – –
Treasury shares sold to TCF employee
benefit plans, 683,787 shares – – – (7,530) – – 17,707 10,177 – 10,177
Cancellation of shares of restricted stock (223,647) – (3) (4,217) 982 – – (3,238) – (3,238)
Cancellation of common shares
for tax withholding (405,674) – (4) (6,474) – – – (6,478) – (6,478)
Amortization of stock compensation – – – 8,344 – – – 8,344 – 8,344
Exercise of stock options, 13,000 shares – – – (173) – – 336 163 – 163
Stock compensation tax benefits – – – 10,110 – – – 10,110 – 10,110
Change in shares held in trust for
deferred compensation plans, at cost – – – (17,426) – – 17,426 – – –
Balance as of December 31, 2008 130,839,378 $ 348,437 $1,308 $330,474 $ 927,893 $ (3,692) $(110,644) $ 1,493,776 $ – $ 1,493,776
Comprehensive income (loss):
Income after income tax expense – – – – 87,097 – – 87,097 (410) 86,687
Other comprehensive loss – – – – – (14,853) – (14,853) – (14,853)
Comprehensive income (loss) – – – – 87,097 (14,853) – 72,244 (410) 71,834
Investment by non-controlling interest – – – – – – – – 4,803 4,803
Dividends on preferred stock – 710 – – (6,378) – – (5,668) – (5,668)
Dividends on common stock – – – – (50,828) – – (50,828) – (50,828)
Non-cash deemed preferred
stock dividend – 12,025 – – (12,025) – – – – –
Redemption of preferred stock – (361,172) – – – – – (361,172) – (361,172)
Grants of restricted stock, 719,727 shares – – – (18,638) – – 18,638 – – –
Treasury shares sold to TCF employee
benefit plans, 1,448,640 shares – – – (18,367) – – 37,514 19,147 – 19,147
Cancellation of shares of restricted stock (481,000) – (5) (818) 243 – – (580) – (580)
Cancellation of common shares
for tax withholding (18,878) – – (250) – – – (250) – (250)
Amortization of stock compensation – – – 8,615 – – – 8,615 – 8,615
Exercise of stock options, 108,800 shares – – – (1,279) – – 2,817 1,538 – 1,538
Stock compensation tax expense – – – (1,058) – – – (1,058) – (1,058)
Change in shares held in trust for
deferred compensation plans, at cost – – – (848) – – 848 – – –
Cost of issuance of common warrants – – – (402) – – – (402) – (402)
Balance as of December 31, 2009 130,339,500 $ – $1,303 $297,429 $ 946,002 $ (18,545) $ (50,827) $ 1,175,362 $ 4,393 $ 1,179,755
Comprehensive income (loss):
Income after income tax expense – – – – 146,564 – – 146,564 3,297 149,861
Other comprehensive loss – – – – – (12,969) – (12,969) – (12,969)
Comprehensive income (loss) – – – – 146,564 (12,969) – 133,595 3,297 136,892
Public offering of common stock 12,322,250 – 124 164,443 – – – 164,567 – 164,567
Investment by non-controlling interest – – – – – – – – 810 810
Dividends on common stock – – – – (27,617) – – (27,617) – (27,617)
Grants of restricted stock, 347,916 shares 20,000 – – (8,491) – – 8,491 – – –
Common shares purchased by TCF
employee benefit plans 442,579 – 4 6,358 – – – 6,362 – 6,362
Treasury shares sold to TCF employee
benefit plans, 757,612 shares – – – (7,893) – – 19,620 11,727 – 11,727
Cancellation of shares of restricted stock (23,723) – – (247) 29 – – (218) – (218)
Cancellation of common shares for
tax withholding (135,594) – (1) (1,946) – – – (1,947) – (1,947)
Amortization of stock compensation – – – 9,534 – – – 9,534 – 9,534
Stock compensation tax benefits – – – 298 – – – 298 – 298
Change in shares held in trust for
deferred compensation plans, at cost – – – 399 – – (399) – – –
Balance as of December 31, 2010 142,965,012 $ – $1,430 $459,884 $1,064,978 $(31,514) $ (23,115) $1,471,663 $8,500 $1,480,163
See accompanying notes to consolidated financial statements.