TCF Bank 2010 Annual Report Download - page 57
Download and view the complete annual report
Please find page 57 of the 2010 TCF Bank annual report below. You can navigate through the pages in the report by either clicking on the pages listed below, or by using the keyword search tool below to find specific information within the annual report.-
 1
1 -
2
-
3
-
4
-
5
-
6
-
7
-
8
-
9
-
10
-
11
-
12
-
13
-
14
-
15
-
16
-
17
-
18
-
19
-
20
-
21
-
22
-
23
-
24
-
25
-
26
-
27
-
28
-
29
-
30
-
31
-
32
-
33
-
34
-
35
-
36
-
37
-
38
-
39
-
40
-
41
-
42
-
43
-
44
-
45
-
46
-
 47
47 -
 48
48 -
 49
49 -
 50
50 -
 51
51 -
 52
52 -
 53
53 -
 54
54 -
 55
55 -
 56
56 -
 57
57 -
 58
58 -
 59
59 -
 60
60 -
 61
61 -
 62
62 -
 63
63 -
 64
64 -
 65
65 -
 66
66 -
 67
67 -
68
-
69
-
70
-
71
-
72
-
73
-
74
-
75
-
76
-
77
-
78
-
79
-
80
-
81
-
82
-
83
-
84
-
85
-
86
-
87
-
88
-
89
-
90
-
91
-
92
-
93
-
94
-
95
-
96
-
97
-
98
-
99
-
100
-
101
-
102
-
103
-
104
-
105
-
106
-
107
-
108
-
109
-
110
-
111
-
112
-
113
-
114
-
115
-
116
-
117
-
118
-
119
-
120
-
121
-
122
-
123
-
124
-
125
-
126
-
127
-
128
-
129
-
130
 |
 |

• 41 •
2010 Form 10-K
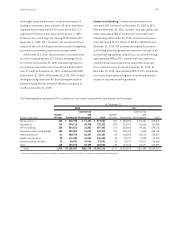
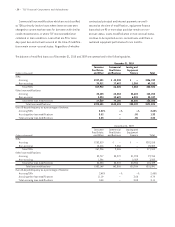
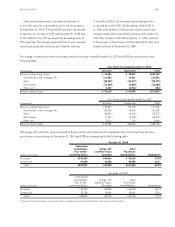
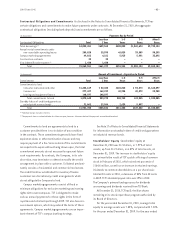
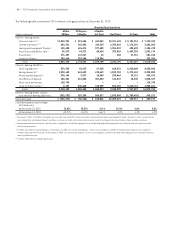
The changes in amount of other real estate owned for the years ended December 31, 2010 and 2009 are summarized in the
following table.
At or For the Year Ended December 31, 2010
(In thousands) Consumer Commercial Total
Balance, at beginning of year $ 66,956 $ 38,812 $105,768
Transferred in, net of charge-offs 121,555 29,541 151,096
Sales (88,358) (10,617) (98,975)
Write-downs (12,640) (4,040) (16,680)
Other, net 2,602 (2,746) (144)
Balance, at end of year $ 90,115 $ 50,950 $141,065
At or For the Year Ended December 31, 2009
(In thousands) Consumer Commercial Total
Balance, at beginning of year $ 38,632 $23,033 $ 61,665
Transferred in, net of charge-offs 102,744 28,604 131,348
Sales (66,901) (9,616) (76,517)
Write-downs (9,731) (3,485) (13,216)
Other, net 2,212 276 2,488
Balance, at end of year $ 66,956 $38,812 $105,768
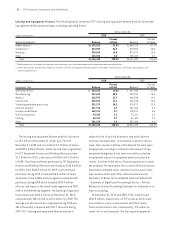
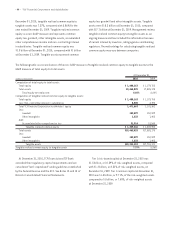
The charge-offs and write-downs recorded to date on other real estate owned compared to the contractual loan balances
prior to non-accrual status at December 31, 2010 and 2009 are summarized in the following table.
December 31, 2010
Contractual
Loan Balance Charge-offs Other
Prior to Non- and Write-downs Real Estate
(Dollars in thousands) performing Status Recorded Owned Balance Impairment(1)
Consumer $134,529 $44,414 $ 90,115 33.0%
Commercial 69,438 18,488 50,950 26.6
Total $203,967 $62,902 $141,065 30.8%
December 31, 2009
Contractual
Loan Balance Charge-offs Other
Prior to Non- and Write-downs Real Estate
(Dollars in thousands) performing Status Recorded Owned Balance Impairment(1)
Consumer $ 91,305 $24,349 $ 66,956 26.7%
Commercial 53,738 14,926 38,812 27.8
Total $145,043 $39,275 $105,768 27.1%
(1) Represents the ratio of charge-offs and write-downs recorded to the contractual loan balances prior to non-performing status.
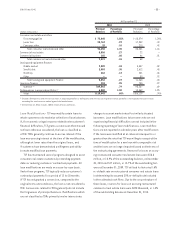
Other real estate owned is recorded at the lower of
cost or fair value less estimated costs to sell the property.
At December 31, 2010, TCF owned 520 consumer real estate
properties, an increase of 222 from December 31, 2009 due
to the addition of 1,019 new properties exceeding sales of
797 properties. The average amount of time to sell consumer
real estate properties once they are listed for sale was
4.2 months in 2010. The consumer real estate portfolio
is secured by a total of 82,543 properties of which 813,
or .98%, were owned or in the process of foreclosure and
included within other real estate owned as of December 31,
2010. This compares with 504 properties, or .57%, owned or
in the process of foreclosure and included within other real
estate owned as of December 31, 2009.