TCF Bank 2010 Annual Report Download - page 50
Download and view the complete annual report
Please find page 50 of the 2010 TCF Bank annual report below. You can navigate through the pages in the report by either clicking on the pages listed below, or by using the keyword search tool below to find specific information within the annual report.-
 1
1 -
2
-
3
-
4
-
5
-
6
-
7
-
8
-
9
-
10
-
11
-
12
-
13
-
14
-
15
-
16
-
17
-
18
-
19
-
20
-
21
-
22
-
23
-
24
-
25
-
26
-
27
-
28
-
29
-
30
-
31
-
32
-
33
-
34
-
35
-
36
-
37
-
38
-
39
-
 40
40 -
 41
41 -
 42
42 -
 43
43 -
 44
44 -
 45
45 -
 46
46 -
 47
47 -
 48
48 -
 49
49 -
 50
50 -
 51
51 -
 52
52 -
 53
53 -
 54
54 -
 55
55 -
 56
56 -
 57
57 -
 58
58 -
 59
59 -
 60
60 -
61
-
62
-
63
-
64
-
65
-
66
-
67
-
68
-
69
-
70
-
71
-
72
-
73
-
74
-
75
-
76
-
77
-
78
-
79
-
80
-
81
-
82
-
83
-
84
-
85
-
86
-
87
-
88
-
89
-
90
-
91
-
92
-
93
-
94
-
95
-
96
-
97
-
98
-
99
-
100
-
101
-
102
-
103
-
104
-
105
-
106
-
107
-
108
-
109
-
110
-
111
-
112
-
113
-
114
-
115
-
116
-
117
-
118
-
119
-
120
-
121
-
122
-
123
-
124
-
125
-
126
-
127
-
128
-
129
-
130
 |
 |
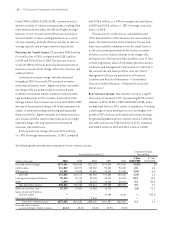
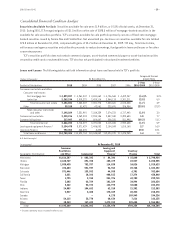
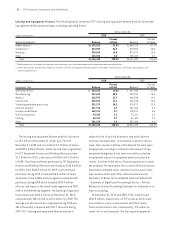
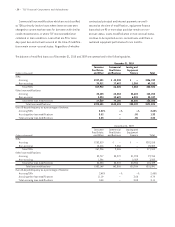
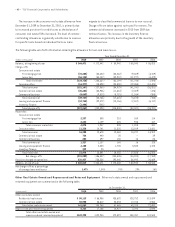
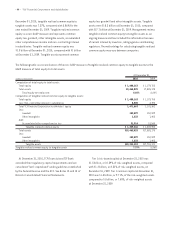
• 34 • TCF Financial Corporation and Subsidiaries
December 31, 2010
Performing Loans and Leases 60+ Days
Delinquent
and
Accruing(2) Accruing
TDRs
Non-accrual
Loans and
Leases Total Loans
and Leases(Dollars in thousands) Non-classified Classified(1) Total
Consumer real estate
and other $ 6,613,610 $ – $ 6,613,610 $76,711 $337,401 $167,547 $ 7,195,269
Commercial real estate
and commercial business 3,091,911 354,185 3,446,096 9,021 48,838 142,248 3,646,203
Leasing and equipment finance 3,073,347 35,695 3,109,042 11,029 – 34,407 3,154,478
Inventory finance 785,245 5,710 790,955 344 – 1,055 792,354
Total loans and leases $13,564,113 $395,590 $13,959,703 $97,105 $386,239 $345,257 $14,788,304
Percent of total loans and leases 91.7% 2.7% 94.4% .7% 2.6% 2.3% 100.0%
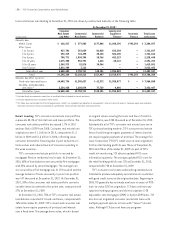
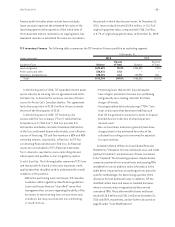
December 31, 2009
Performing Loans and Leases 60+ Days
Delinquent
and
Accruing(2) Accruing
TDRs
Non-accrual
Loans and
Leases Total Loans
and Leases(Dollars in thousands) Non-classified Classified(1) Total
Consumer real estate
and other $ 6,863,222 $ – $ 6,863,222 $76,959 $252,510 $139,300 $ 7,331,991
Commercial real estate
and commercial business 3,280,957 331,298 3,612,255 68 – 106,196 3,718,519
Leasing and equipment finance 2,967,540 31,767 2,999,307 22,114 – 50,008 3,071,429
Inventory finance 467,319 – 467,319 715 – 771 468,805
Total loans and leases $13,579,038 $363,065 $13,942,103 $99,856 $252,510 $296,275 $14,590,744
Percent of total loans and leases 93.1% 2.5% 95.6% .7% 1.7% 2.0% 100.0%
(1) Excludes classified loans and leases that are 60+ days delinquent or accruing TDRs.
(2) Excludes accruing TDRs that are 60+ days delinquent.
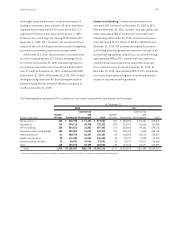
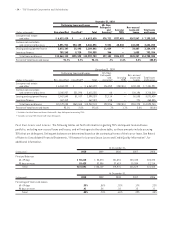
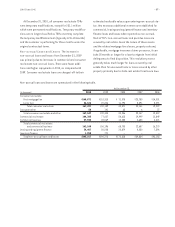
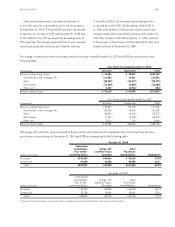
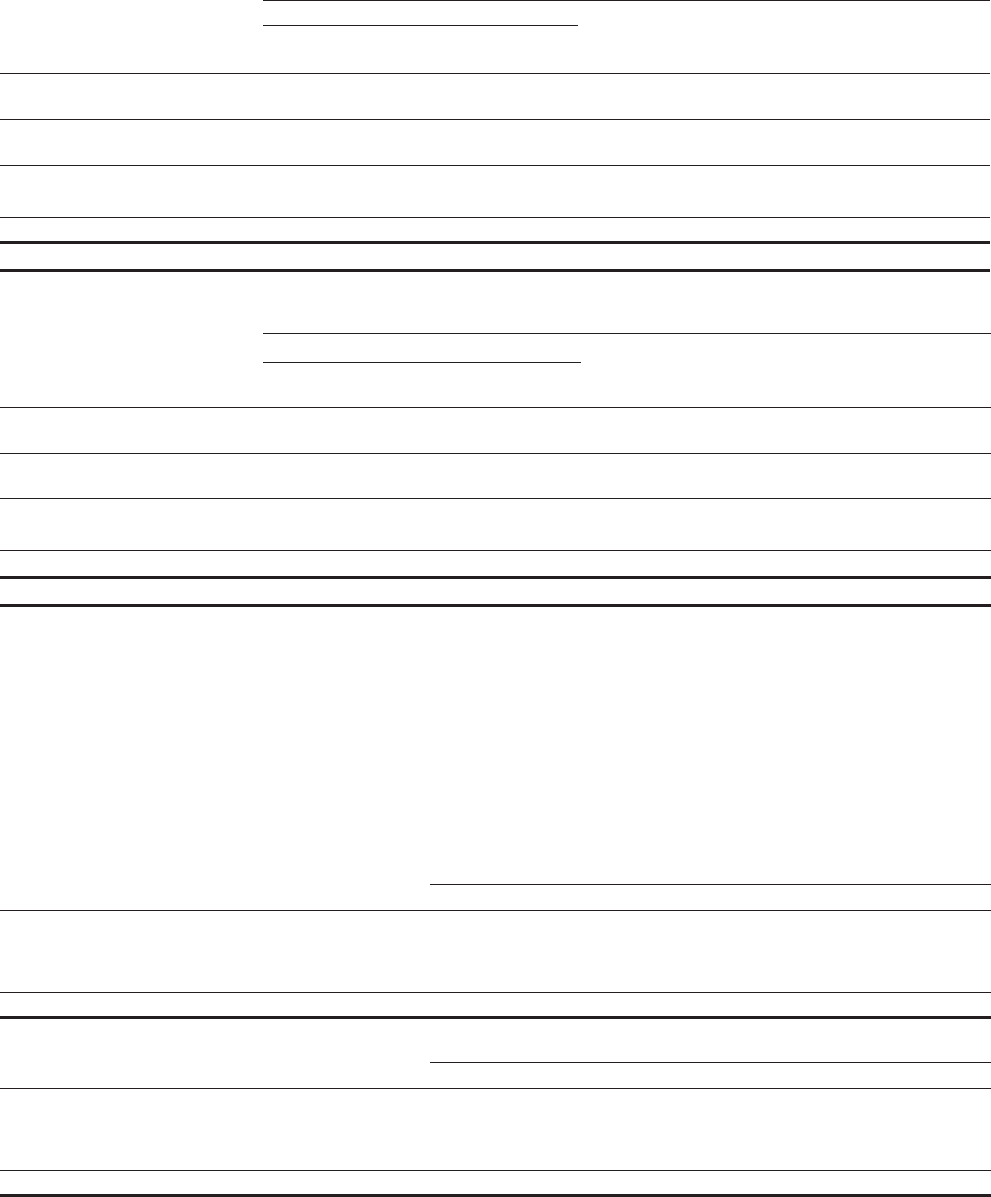
Past Due Loans and Leases The following tables set forth information regarding TCF’s delinquent loan and lease
portfolio, excluding non-accrual loans and leases, and will not agree to the above table, as these amounts include accruing
TDRs that are delinquent. Delinquent balances are determined based on the contractual terms of the loan or lease. See Note 6
of Notes to Consolidated Financial Statements, “Allowance for Loan and Lease Losses and Credit Quality Information”, for
additional information.
At December 31,
(In thousands) 2010 2009 2008 2007 2006
Principal Balances
60-89 days $ 55,618 $ 54,073 $41,851 $20,445 $24,872
90 days or more 59,425 52,056 37,619 15,384 12,214
Total $115,043 $106,129 $79,470 $35,829 $37,086
At December 31,
(In thousands) 2010 2009 2008 2007 2006
Percentage of Loans and Leases
60-89 days .39% .38% .32% .17% .22%
90 days or more .41 .36 .28 .12 .11
Total .80% .74% .60% .29% .33%