TCF Bank 2010 Annual Report Download - page 54
Download and view the complete annual report
Please find page 54 of the 2010 TCF Bank annual report below. You can navigate through the pages in the report by either clicking on the pages listed below, or by using the keyword search tool below to find specific information within the annual report.-
 1
1 -
2
-
3
-
4
-
5
-
6
-
7
-
8
-
9
-
10
-
11
-
12
-
13
-
14
-
15
-
16
-
17
-
18
-
19
-
20
-
21
-
22
-
23
-
24
-
25
-
26
-
27
-
28
-
29
-
30
-
31
-
32
-
33
-
34
-
35
-
36
-
37
-
38
-
39
-
40
-
41
-
42
-
43
-
 44
44 -
 45
45 -
 46
46 -
 47
47 -
 48
48 -
 49
49 -
 50
50 -
 51
51 -
 52
52 -
 53
53 -
 54
54 -
 55
55 -
 56
56 -
 57
57 -
 58
58 -
 59
59 -
 60
60 -
 61
61 -
 62
62 -
 63
63 -
 64
64 -
65
-
66
-
67
-
68
-
69
-
70
-
71
-
72
-
73
-
74
-
75
-
76
-
77
-
78
-
79
-
80
-
81
-
82
-
83
-
84
-
85
-
86
-
87
-
88
-
89
-
90
-
91
-
92
-
93
-
94
-
95
-
96
-
97
-
98
-
99
-
100
-
101
-
102
-
103
-
104
-
105
-
106
-
107
-
108
-
109
-
110
-
111
-
112
-
113
-
114
-
115
-
116
-
117
-
118
-
119
-
120
-
121
-
122
-
123
-
124
-
125
-
126
-
127
-
128
-
129
-
130
 |
 |

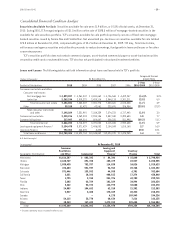
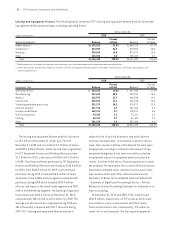
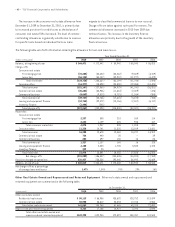
• 38 • TCF Financial Corporation and Subsidiaries
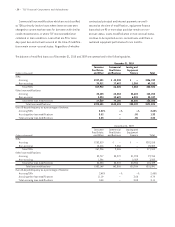
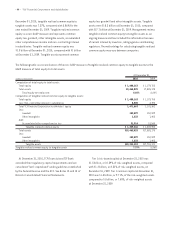
The changes in amount of non-accrual loans and leases for the years ended December 31, 2010 and 2009 are summarized in
the following table.
At or For the Year Ended December 31, 2010
Leasing and
Equipment Inventory
(In thousands) Consumer Commercial Finance Finance Total
Balance, at beginning of year $139,300 $106,196 $ 50,008 $ 771 $ 296,275
Additions 245,695 137,585 56,033 6,278 445,591
Charge-offs (57,194) (45,804) (27,938) (79) (131,015)
Transfers to other assets (98,446) (33,127) (15,291) (288) (147,152)
Return to accrual status (48,999) – (4,364) (4,115) (57,478)
Payments received (8,576) (26,546) (24,041) (1,575) (60,738)
Other, net (4,233) 3,944 – 63 (226)
Balance, at end of year $167,547 $142,248 $ 34,407 $ 1,055 $ 345,257
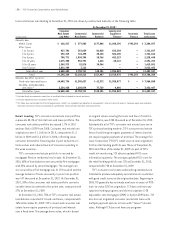
At or For the Year Ended December 31, 2009
Leasing and
Equipment Inventory
(In thousands) Consumer Commercial Finance Finance Total
Balance, at beginning of year $ 82,936 $ 68,703 $ 20,879 $ – $ 172,518
Additions 223,785 127,951 97,260 2,515 451,511
Charge-offs (43,180) (41,663) (27,616) (64) (112,523)
Transfers to other assets (85,944) (28,151) (20,179) – (134,274)
Return to accrual status (30,274) (3,304) (3,927) – (37,505)
Payments received (6,136) (15,754) (15,905) (1,680) (39,475)
Other, net (1,887) (1,586) (504) – (3,977)
Balance, at end of year $139,300 $106,196 $ 50,008 $ 771 $ 296,275
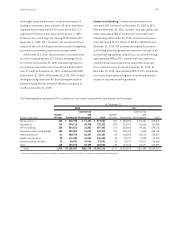
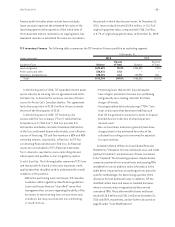
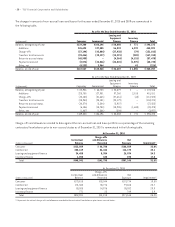
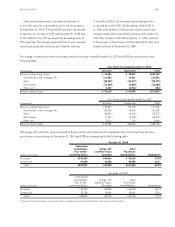
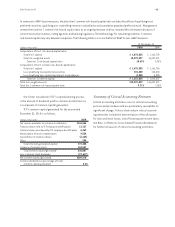
Charge-offs and allowance recorded to date against the non-accrual loan and lease portfolio as a percentage of the remaining
contractual loan balance prior to non-accrual status as of December 31, 2010 is summarized in the following table.
At December 31, 2010
Charge-offs
Contractual and Allowance Net
(Dollars in thousands) Balance Recorded Exposure Impairment(1)
Consumer $212,809 $ 46,780 $166,029 22.0%
Commercial 200,619 86,446 114,173 43.1
Leasing and equipment finance 34,458 8,384 26,074 24.3
Inventory finance 1,055 185 870 17.5
Total $448,941 $141,795 $307,146 31.6%
At December 31, 2009
Charge-offs
Contractual and Allowance Net
(Dollars in thousands) Balance Recorded Exposure Impairment(1)
Consumer $170,818 $33,044 $137,774 19.3%
Commercial 131,384 33,776 97,608 25.7
Leasing and equipment finance 50,008 14,976 35,032 29.9
Inventory finance 771 22 749 2.9
Total $352,981 $81,818 $271,163 23.2%
(1) Represents the ratio of charge-offs and allowance recorded to the contractual loan balances prior to non-accrual status.