TCF Bank 2010 Annual Report Download - page 71
Download and view the complete annual report
Please find page 71 of the 2010 TCF Bank annual report below. You can navigate through the pages in the report by either clicking on the pages listed below, or by using the keyword search tool below to find specific information within the annual report.-
 1
1 -
2
-
3
-
4
-
5
-
6
-
7
-
8
-
9
-
10
-
11
-
12
-
13
-
14
-
15
-
16
-
17
-
18
-
19
-
20
-
21
-
22
-
23
-
24
-
25
-
26
-
27
-
28
-
29
-
30
-
31
-
32
-
33
-
34
-
35
-
36
-
37
-
38
-
39
-
40
-
41
-
42
-
43
-
44
-
45
-
46
-
47
-
48
-
49
-
50
-
51
-
52
-
53
-
54
-
55
-
56
-
57
-
58
-
59
-
60
-
 61
61 -
 62
62 -
 63
63 -
 64
64 -
 65
65 -
 66
66 -
 67
67 -
 68
68 -
 69
69 -
 70
70 -
 71
71 -
 72
72 -
 73
73 -
 74
74 -
 75
75 -
 76
76 -
 77
77 -
 78
78 -
 79
79 -
 80
80 -
 81
81 -
82
-
83
-
84
-
85
-
86
-
87
-
88
-
89
-
90
-
91
-
92
-
93
-
94
-
95
-
96
-
97
-
98
-
99
-
100
-
101
-
102
-
103
-
104
-
105
-
106
-
107
-
108
-
109
-
110
-
111
-
112
-
113
-
114
-
115
-
116
-
117
-
118
-
119
-
120
-
121
-
122
-
123
-
124
-
125
-
126
-
127
-
128
-
129
-
130
 |
 |

• 55 •
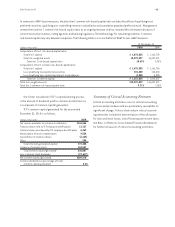
2010 Form 10-K
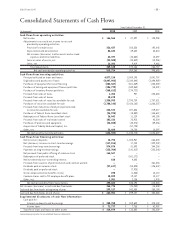
Consolidated Statements of Cash Flows
Year Ended December 31,
(In thousands) 2010 2009 2008
Cash flows from operating activities:
Net income $ 146,564 $ 87,097 $ 128,958
Adjustments to reconcile net income to net cash
provided by operating activities:
Provision for credit losses 236,437 258,536 192,045
Depreciation and amortization 86,632 69,632 64,813
Net increase (decrease) in other assets and accrued
expenses and other liabilities 62,397 (34,882) 14,397
Gains on sales of assets, net (32,508) (30,539) (13,986)
Other, net 16,202 9,419 9,468
Total adjustments 369,160 272,166 266,737
Net cash provided by operating activities 515,724 359,263 395,695
Cash flows from investing activities:
Principal collected on loans and leases 4,877,210 3,380,198 3,041,757
Originations and purchases of loans (4,447,982) (3,340,040) (3,494,969)
Purchases of equipment for lease financing (802,587) (801,569) (850,459)
Purchase of leasing and equipment finance portfolios (186,779) (339,860) (15,001)
Purchase of inventory finance portfolios (168,612) (274,722) –
Proceeds from sales of loans 1,456 937 245,884
Proceeds from sales of leases 10,670 – –
Proceeds from sales of securities available for sale 1,330,955 2,293,739 1,707,821
Purchases of securities available for sale (1,788,142) (2,436,163) (1,888,527)
Proceeds from maturities of and principal collected
on securities available for sale 436,574 327,856 219,017
Purchases of Federal Home Loan Bank stock (34,925) (18,882) (144,611)
Redemptions of Federal Home Loan Bank stock 26,042 11,129 140,196
Proceeds from sales of real estate owned 103,236 25,913 43,324
Purchases of premises and equipment (36,088) (40,276) (49,556)
Acquisition of Fidelity National Capital, Inc. – (57,728) –
Other, net 32,420 28,758 18,297
Net cash used by investing activities (646,552) (1,240,710) (1,026,827)
Cash flows from financing activities:
Net increase in deposits 16,796 1,324,967 666,803
Net (decrease) increase in short-term borrowings (117,814) 17,743 (329,209)
Proceeds from long-term borrowings 574,876 31,393 344,258
Payments on long-term borrowings (135,704) (141,012) (323,348)
Net proceeds from public offering of common stock 164,567 – –
Redemption of preferred stock – (361,172) –
Net investment by non-controlling interest 810 4,803 –
Proceeds from issuance of preferred stock and common warrant – – 361,004
Dividends paid on common stock (27,617) (50,828) (126,447)
Dividends paid on preferred stock – (7,925) –
Stock compensation tax benefits (costs) 298 (1,058) 10,110
Common shares sold to TCF employee benefit plans 18,089 19,147 10,177
Other, net 1,301 2,136 1,976
Net cash provided by financing activities 495,602 838,194 615,324
Net increase (decrease) in cash and due from banks 364,774 (43,253) (15,808)
Cash and due from banks at beginning of year 299,127 342,380 358,188
Cash and due from banks at end of year $ 663,901 $ 299,127 $ 342,380
Supplemental disclosures of cash flow information:
Cash paid for:
Interest on deposits and borrowings $ 258,750 $ 329,609 $ 378,132
Income taxes $ 72,777 $ 7,788 $ 42,957
Transfer of loans and leases to other assets $ 214,079 $ 135,682 $ 103,359
See accompanying notes to consolidated financial statements.