TCF Bank 2010 Annual Report Download - page 66
Download and view the complete annual report
Please find page 66 of the 2010 TCF Bank annual report below. You can navigate through the pages in the report by either clicking on the pages listed below, or by using the keyword search tool below to find specific information within the annual report.-
 1
1 -
2
-
3
-
4
-
5
-
6
-
7
-
8
-
9
-
10
-
11
-
12
-
13
-
14
-
15
-
16
-
17
-
18
-
19
-
20
-
21
-
22
-
23
-
24
-
25
-
26
-
27
-
28
-
29
-
30
-
31
-
32
-
33
-
34
-
35
-
36
-
37
-
38
-
39
-
40
-
41
-
42
-
43
-
44
-
45
-
46
-
47
-
48
-
49
-
50
-
51
-
52
-
53
-
54
-
55
-
 56
56 -
 57
57 -
 58
58 -
 59
59 -
 60
60 -
 61
61 -
 62
62 -
 63
63 -
 64
64 -
 65
65 -
 66
66 -
 67
67 -
 68
68 -
 69
69 -
 70
70 -
 71
71 -
 72
72 -
 73
73 -
 74
74 -
 75
75 -
 76
76 -
77
-
78
-
79
-
80
-
81
-
82
-
83
-
84
-
85
-
86
-
87
-
88
-
89
-
90
-
91
-
92
-
93
-
94
-
95
-
96
-
97
-
98
-
99
-
100
-
101
-
102
-
103
-
104
-
105
-
106
-
107
-
108
-
109
-
110
-
111
-
112
-
113
-
114
-
115
-
116
-
117
-
118
-
119
-
120
-
121
-
122
-
123
-
124
-
125
-
126
-
127
-
128
-
129
-
130
 |
 |

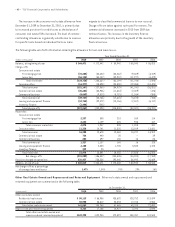
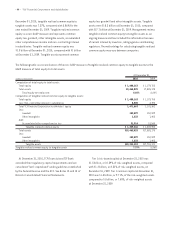
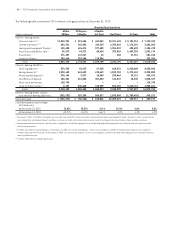
• 50 • TCF Financial Corporation and Subsidiaries
The following table summarizes TCF’s interest-rate gap position at December 31, 2010.
Maturity/Rate Sensitivity
Within 30 Days to 6 Months
(Dollars in thousands) 30 Days 6 Months to 1 Year 1 to 3 Years 3+ Years Total
Interest-earning assets:
Consumer loans (1) (2) $1,022,951 $ 391,684 $ 441,042 $2,157,678 $ 3,181,914 $ 7,195,269
Commercial loans (1) (2) 452,911 301,442 324,193 1,395,466 1,172,191 3,646,203
Leasing and equipment finance (2) 155,630 626,474 577,485 1,356,257 438,632 3,154,478
Securities available for sale (2) 38,273 64,272 88,414 333,026 1,407,189 1,931,174
Investments 371,407 141,567 62 368 37,761 551,165
Inventory finance 360,646 253,204 178,504 – – 792,354
Total 2,401,818 1,778,643 1,609,700 5,242,795 6,237,687 17,270,643
Interest-bearing liabilities:
Checking deposits (3) 575,930 62,673 67,230 860,831 2,963,400 4,530,064
Savings deposits (3) 1,592,682 462,632 470,622 1,589,703 1,275,163 5,390,802
Money market deposits (3) 330,149 9,837 10,349 250,466 35,121 635,922
Certificates of deposit 100,451 412,856 357,483 146,837 10,700 1,028,327
Short-term borrowings 126,790 – – – – 126,790
Long-term borrowings (4) 8,107 548,460 138,389 501,152 3,662,713 4,858,821
Total 2,734,109 1,496,458 1,044,073 3,348,989 7,947,097 16,570,726
Interest-earning assets (under)
over interest-bearing liabilities (332,291) 282,185 565,627 1,893,806 (1,709,410) 699,917
Cumulative gap $ (332,291) $ (50,106) $ 515,521 $2,409,327 $ 699,917 $ 699,917
Cumulative gap as a percentage
of total assets:
At December 31, 2010 (1.8)% (0.3)% 2.8 % 13.0% 3.8% 3.8%
At December 31, 2009 (12.9)% (8.9)% (6.6)% 4.2% 1.9% 1.9%
(1) At January 1, 2011, $1.4 billion of variable-rate consumer loans and $397 million of variable-rate commercial loans were modeled as fixed-rate loans as their current interest
rate is below their contractual interest rate floor. An increase in short-term interest rates may not result in a change in the interest rate on these variable-rate loans.
(2) Based upon contractual maturity, repricing date, if applicable, scheduled repayments of principal and projected prepayments of principal based upon experience and
third-party projections.
(3) Includes non-interest bearing deposits. At December 31, 2010, 16% of checking deposits, 47% of savings deposits, and 55% of money market deposits are included in
amounts repricing within one year. At December 31, 2009, 18% of checking deposits, 51% of savings deposits, and 54% of money market deposits are included in amounts
repricing within one year.
(4) Includes $700 million of callable borrowings.