TCF Bank 2010 Annual Report Download - page 100
Download and view the complete annual report
Please find page 100 of the 2010 TCF Bank annual report below. You can navigate through the pages in the report by either clicking on the pages listed below, or by using the keyword search tool below to find specific information within the annual report.-
 1
1 -
2
-
3
-
4
-
5
-
6
-
7
-
8
-
9
-
10
-
11
-
12
-
13
-
14
-
15
-
16
-
17
-
18
-
19
-
20
-
21
-
22
-
23
-
24
-
25
-
26
-
27
-
28
-
29
-
30
-
31
-
32
-
33
-
34
-
35
-
36
-
37
-
38
-
39
-
40
-
41
-
42
-
43
-
44
-
45
-
46
-
47
-
48
-
49
-
50
-
51
-
52
-
53
-
54
-
55
-
56
-
57
-
58
-
59
-
60
-
61
-
62
-
63
-
64
-
65
-
66
-
67
-
68
-
69
-
70
-
71
-
72
-
73
-
74
-
75
-
76
-
77
-
78
-
79
-
80
-
81
-
82
-
83
-
84
-
85
-
86
-
87
-
88
-
89
-
 90
90 -
 91
91 -
 92
92 -
 93
93 -
 94
94 -
 95
95 -
 96
96 -
 97
97 -
 98
98 -
 99
99 -
 100
100 -
 101
101 -
 102
102 -
 103
103 -
 104
104 -
 105
105 -
 106
106 -
 107
107 -
 108
108 -
 109
109 -
 110
110 -
111
-
112
-
113
-
114
-
115
-
116
-
117
-
118
-
119
-
120
-
121
-
122
-
123
-
124
-
125
-
126
-
127
-
128
-
129
-
130
 |
 |
• 84 • TCF Financial Corporation and Subsidiaries
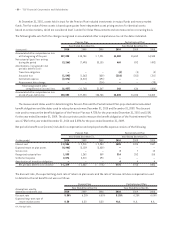
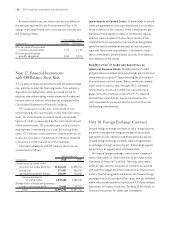
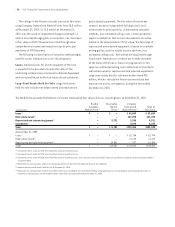
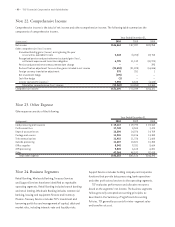
The following table summarizes the pre-tax impact
of foreign exchange activity on other non-interest
expense within the Consolidated Statements of Income
and Consolidated Statements of Financial Condition, by
accounting designation.
Year Ended
(In thousands) December 31, 2010
Foreign exchange gains $ 1,720
Forward foreign exchange contract losses:
Net investment hedge –
Cash flow hedge –
Not designated as hedges (1,976)
Total (1,976)
Accumulated other comprehensive income (loss):
Foreign currency translation adjustment 575
Net investment hedge (195)
Cash flow hedge (1)
Total $ 379
TCF executes all of its foreign exchange contracts in
the over-the-counter market with large, international
financial institutions. These contracts also include credit
risk-related contingent features, primarily in the form
of International Swaps and Derivatives Association, Inc.
(“ISDA”) master agreements that enhance the credit-
worthiness of these instruments as compared to other
obligations of the respective counterparty with whom TCF
has transacted. These contingent features may be for the
benefit of TCF, as well as its counterparties with respect to
changes in TCF’s creditworthiness. At December 31, 2010,
TCF had posted $854 thousand of U.S. Treasury securities
as collateral in the normal course of business under such
agreements. The amount of collateral required depends on
the contract and is determined daily based on market and
currency exchange rate conditions.
In connection with certain over-the-counter forward
foreign exchange contracts, TCF could be required to provide
additional collateral or to terminate transactions with
certain counterparties in the event that, among other
things, TCF National Bank’s long-term debt is rated less than
BB- by Standard and Poor’s ratings group. At December 31,
2010, approximately $1.3 million of additional collateral
would be required if the credit risk-related contingent
features were triggered, which would bring the total
collateral required to $2.1 million at December 31, 2010.
There were $349 thousand of forward foreign exchange
contracts containing credit risk related features in a net
liability position at December 31, 2010.
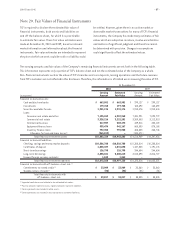
Note 19. Fair Value Measurement
Fair values represent the estimated price that would
be received from selling an asset or paid to transfer a
liability, otherwise known as an “exit price”. The following
is a description of valuation methodologies used for
assets recorded at fair value on a recurring basis at
December 31, 2010.
Securities Available for Sale Securities available
for sale consist primarily of U.S. Government sponsored
enterprise securities and U.S. Treasury bills. The fair
value of U.S. Government sponsored enterprise securities
is recorded using prices obtained from independent
asset pricing services that are based on observable
transactions, but not quoted markets, and are classified
as Level 2 assets. The fair value of U.S. Treasury bills is
recorded using prices obtained from independent asset
pricing services that obtain prices from brokers and active
market participants, and are classified as Level 1 assets.
Management reviews the prices obtained from independent
asset pricing services for unusual fluctuations and
comparisons to current market trading activity. However,
management does not adjust these prices.
Other securities, for which there is little or no market
activity, are categorized as Level 3 assets. Other securities
classified as Level 3 assets include equity investments
in other thinly traded financial institutions and foreign
debt securities. The fair value of these assets is determined
by using quoted prices, when available, and incorporating
results of internal pricing techniques and observable
market information, which is adjusted for security
specific information, such as financial statement strength,
earnings history, disclosed fair value measurements,
recorded impairments and key financial ratios, to
determine fair value.
Assets Held in Trust for Deferred Compensation
Assets held in trust for deferred compensation plans
included investments in publicly traded stocks, excluding
TCF common stock reported in treasury and other in equity,
and mutual funds. The fair value of these assets is based
upon prices obtained from independent asset pricing
services based on active markets.