TCF Bank 2010 Annual Report Download - page 38
Download and view the complete annual report
Please find page 38 of the 2010 TCF Bank annual report below. You can navigate through the pages in the report by either clicking on the pages listed below, or by using the keyword search tool below to find specific information within the annual report.-
 1
1 -
2
-
3
-
4
-
5
-
6
-
7
-
8
-
9
-
10
-
11
-
12
-
13
-
14
-
15
-
16
-
17
-
18
-
19
-
20
-
21
-
22
-
23
-
24
-
25
-
26
-
27
-
 28
28 -
 29
29 -
 30
30 -
 31
31 -
 32
32 -
 33
33 -
 34
34 -
 35
35 -
 36
36 -
 37
37 -
 38
38 -
 39
39 -
 40
40 -
 41
41 -
 42
42 -
 43
43 -
 44
44 -
 45
45 -
 46
46 -
 47
47 -
 48
48 -
49
-
50
-
51
-
52
-
53
-
54
-
55
-
56
-
57
-
58
-
59
-
60
-
61
-
62
-
63
-
64
-
65
-
66
-
67
-
68
-
69
-
70
-
71
-
72
-
73
-
74
-
75
-
76
-
77
-
78
-
79
-
80
-
81
-
82
-
83
-
84
-
85
-
86
-
87
-
88
-
89
-
90
-
91
-
92
-
93
-
94
-
95
-
96
-
97
-
98
-
99
-
100
-
101
-
102
-
103
-
104
-
105
-
106
-
107
-
108
-
109
-
110
-
111
-
112
-
113
-
114
-
115
-
116
-
117
-
118
-
119
-
120
-
121
-
122
-
123
-
124
-
125
-
126
-
127
-
128
-
129
-
130
 |
 |

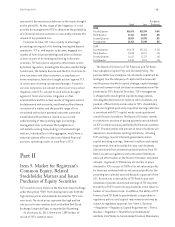
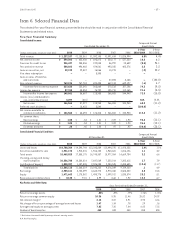
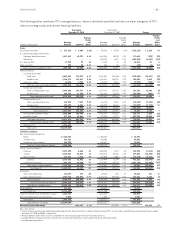
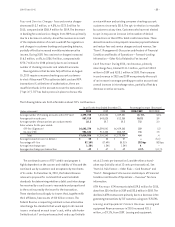
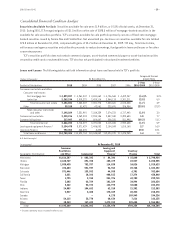
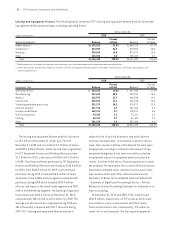
• 22 • TCF Financial Corporation and Subsidiaries
Year Ended Year Ended
December 31, 2009 December 31, 2008 Change
Average
Average Average Yields
Yields Yields and
Average and Average and Average Rates
(Dollars in thousands) Balance Interest(1) Rates Balance Interest (1) Rates Balance Interest(1) (bps)
Assets:
Investments and other $ 375,396 $ 4,370 1.16% $ 155,839 $ 5,937 3.81% $ 219,557 $ (1,567) (265)
U.S. Government sponsored entities:
Mortgage-backed securities 1,645,544 80,902 4.92 2,100,291 110,502 5.26 (454,747) (29,600) (34)
Debentures 389,245 8,487 2.18 – – – 389,245 8,487 218
U.S. Treasury Bills 17,123 12 .07 8,929 294 3.29 8,194 (282) (322)
Other securities 494 26 5.26 3,745 150 4.01 (3,251) (124) 125
Total securities available for sale (2) 2,052,406 89,427 4.36 2,112,965 110,946 5.25 (60,559) (21,519) (89)
Loans and leases:
Consumer real estate:
Fixed-rate 5,421,081 348,400 6.43 5,532,198 372,067 6.73 (111,117) (23,667) (30)
Variable-rate 1,862,267 106,988 5.75 1,714,827 109,115 6.36 147,440 (2,127) (61)
Consumer — other 35,849 3,061 8.54 132,891 9,233 6.95 (97,042) (6,172) 159
Total consumer real estate and other 7,319,197 458,449 6.26 7,379,916 490,415 6.65 (60,719) (31,966) (39)
Commercial real estate:
Fixed- and adjustable-rate 2,574,818 155,812 6.05 2,127,436 132,014 6.21 447,382 23,798 (16)
Variable-rate 561,881 22,544 4.01 597,071 31,110 5.21 (35,190) (8,566) (120)
Total commercial real estate 3,136,699 178,356 5.69 2,724,507 163,124 5.99 412,192 15,232 (30)
Commercial business:
Fixed- and adjustable-rate 166,745 9,581 5.75 168,554 9,988 5.93 (1,809) (407) (18)
Variable-rate 308,929 10,644 3.45 366,593 18,143 4.95 (57,664) (7,499) (150)
Total commercial business 475,674 20,225 4.25 535,147 28,131 5.26 (59,473) (7,906) (101)
Total commercial 3,612,373 198,581 5.50 3,259,654 191,255 5.87 352,719 7,326 (37)
Leasing and equipment finance 2,826,835 192,557 6.81 2,265,391 165,838 7.32 561,444 26,719 (51)
Inventory finance 179,990 14,797 8.22 40 4 10.00 179,950 14,793 (178)
Total loans and leases (3) 13,938,395 864,384 6.20 12,905,001 847,512 6.57 1,033,394 16,872 (37)
Total interest-earning assets 16,366,197 958,181 5.85 15,173,805 964,395 6.36 1,192,392 (6,214) (51)
Other assets (4) 1,157,314 1,158,545 (1,231)
Total assets $17,523,511 $16,332,350 $1,191,161
Liabilities and Equity:
Non-interest bearing deposits:
Retail $ 1,402,442 $ 1,408,657 $ (6,215)
Small business 584,605 583,611 994
Commercial and custodial 265,681 231,903 33,778
Total non-interest bearing deposits 2,252,728 2,224,171 28,557
Interest-bearing deposits:
Checking 1,802,694 8,137 .45 1,830,361 12,933 .71 (27,667) (4,796) (26)
Savings 4,732,316 58,556 1.24 2,812,115 48,601 1.73 1,920,201 9,955 (49)
Money market 683,030 7,006 1.03 613,543 10,099 1.65 69,487 (3,093) (62)
Subtotal 7,218,040 73,699 1.02 5,256,019 71,633 1.37 1,962,021 2,066 (35)
Certificates of deposit 1,915,467 48,413 2.53 2,472,357 85,141 3.44 (556,890) (36,728) (91)
Total interest-bearing deposits 9,133,507 122,112 1.34 7,728,376 156,774 2.03 1,405,131 (34,662) (69)
Total deposits 11,386,235 122,112 1.07 9,952,547 156,774 1.58 1,433,688 (34,662) (51)
Borrowings:
Short-term borrowings 85,228 233 .27 411,763 8,990 2.18 (326,535) (8,757) (191)
Long-term borrowings 4,373,182 202,830 4.64 4,459,703 204,958 4.60 (86,521) (2,128) 4
Total borrowings 4,458,410 203,063 4.55 4,871,466 213,948 4.39 (413,056) (10,885) 16
Total interest-bearing liabilities 13,591,917 325,175 2.39 12,599,842 370,722 2.94 992,075 (45,547) (55)
Total deposits and borrowings 15,844,645 325,175 2.05 14,824,013 370,722 2.50 1,020,632 (45,547) (45)
Other liabilities 416,555 359,223 57,332
Total liabilities 16,261,200 15,183,236 1,077,964
Total TCF Financial Corp. stockholders’ equity 1,261,219 1,149,114 112,105
Non-controlling interest in subsidiaries 1,092 – 1,092
Total equity 1,262,311 1,149,114 113,197
Total liabilities and equity $17,523,511 $16,332,350 $1,191,161
Net interest income and margin $633,006 3.87% $593,673 3.91% $ 39,333 (4)
bps = basis points.
(1) Interest income excludes the taxable equivalent adjustments (based on the U.S. federal statutory rate of 35%) of $494 thousand and $593 thousand during the years ended
December 31, 2009 and 2008, respectively.
(2) Average balance and yield of securities available for sale are based upon the historical amortized cost.
(3) Average balance of loans and leases includes non-accrual loans and leases, and is presented net of unearned income.
(4) Includes operating leases.