TCF Bank 2010 Annual Report Download - page 3
Download and view the complete annual report
Please find page 3 of the 2010 TCF Bank annual report below. You can navigate through the pages in the report by either clicking on the pages listed below, or by using the keyword search tool below to find specific information within the annual report.-
 1
1 -
 2
2 -
 3
3 -
 4
4 -
 5
5 -
 6
6 -
 7
7 -
 8
8 -
 9
9 -
 10
10 -
 11
11 -
 12
12 -
 13
13 -
 14
14 -
15
-
16
-
17
-
18
-
19
-
20
-
21
-
22
-
23
-
24
-
25
-
26
-
27
-
28
-
29
-
30
-
31
-
32
-
33
-
34
-
35
-
36
-
37
-
38
-
39
-
40
-
41
-
42
-
43
-
44
-
45
-
46
-
47
-
48
-
49
-
50
-
51
-
52
-
53
-
54
-
55
-
56
-
57
-
58
-
59
-
60
-
61
-
62
-
63
-
64
-
65
-
66
-
67
-
68
-
69
-
70
-
71
-
72
-
73
-
74
-
75
-
76
-
77
-
78
-
79
-
80
-
81
-
82
-
83
-
84
-
85
-
86
-
87
-
88
-
89
-
90
-
91
-
92
-
93
-
94
-
95
-
96
-
97
-
98
-
99
-
100
-
101
-
102
-
103
-
104
-
105
-
106
-
107
-
108
-
109
-
110
-
111
-
112
-
113
-
114
-
115
-
116
-
117
-
118
-
119
-
120
-
121
-
122
-
123
-
124
-
125
-
126
-
127
-
128
-
129
-
130
 |
 |

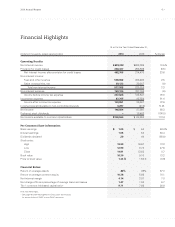
Financial Highlights
At or For the Year Ended December 31,
(Dollars in thousands, except per-share data) 2010 2009 % Change
Operating Results:
Net interest income $699,202 $633,006 10.5%
Provision for credit losses 236,437 258,536 (8.5)
Net interest income after provision for credit losses 462,765 374,470 23.6
Non-interest income:
Fees and other revenue 508,862 496,468 2.5
Gains on securities, net 29,123 29,387 (.9)
Total non-interest income 537,985 525,855 2.3
Non-interest expense 763,124 767,784 (.6)
Income before income tax expense 237,626 132,541 79.3
Income tax expense 87,765 45,854 91.4
Income after income tax expense 149,861 86,687 72.9
Income (loss) attributable to non-controlling interests 3,297 (410) N.M.
Net income 146,564 87,097 68.3
Preferred stock dividends – 18,403 (100.0)
Net income available to common stockholders $146,564 $ 68,694 113.4
Per Common Share Information:
Basic earnings $ 1.05 $ .54 94.4%
Diluted earnings 1.05 .54 94.4
Dividends declared .20 .40 (50.0)
Stock price:
High 18.89 16.67 13.3
Low 12.90 8.74 47.6
Close 14.81 13.62 8.7
Book value 10.30 9.10 13.2
Price to book value 1.44 X 1.50 X (3.9)
Financial Ratios:
Return on average assets .82% .49% 67.3
Return on average common equity 10.36 5.95 74.1
Net interest margin 4.14 3.87 7.0
Net charge-offs as a percentage of average loans and leases 1.47 1.34 9.7
Tier 1 common risk-based capital ratio(1) 9.71 7.65 26.9
N.M. Not Meaningful.
(1) See page 45 under Management’s Discussion and Analysis
for reconciliation of GAAP to non-GAAP measures.
• 1 •
2010 Annual Report