TCF Bank 2010 Annual Report Download - page 36
Download and view the complete annual report
Please find page 36 of the 2010 TCF Bank annual report below. You can navigate through the pages in the report by either clicking on the pages listed below, or by using the keyword search tool below to find specific information within the annual report.-
 1
1 -
2
-
3
-
4
-
5
-
6
-
7
-
8
-
9
-
10
-
11
-
12
-
13
-
14
-
15
-
16
-
17
-
18
-
19
-
20
-
21
-
22
-
23
-
24
-
25
-
 26
26 -
 27
27 -
 28
28 -
 29
29 -
 30
30 -
 31
31 -
 32
32 -
 33
33 -
 34
34 -
 35
35 -
 36
36 -
 37
37 -
 38
38 -
 39
39 -
 40
40 -
 41
41 -
 42
42 -
 43
43 -
 44
44 -
 45
45 -
 46
46 -
47
-
48
-
49
-
50
-
51
-
52
-
53
-
54
-
55
-
56
-
57
-
58
-
59
-
60
-
61
-
62
-
63
-
64
-
65
-
66
-
67
-
68
-
69
-
70
-
71
-
72
-
73
-
74
-
75
-
76
-
77
-
78
-
79
-
80
-
81
-
82
-
83
-
84
-
85
-
86
-
87
-
88
-
89
-
90
-
91
-
92
-
93
-
94
-
95
-
96
-
97
-
98
-
99
-
100
-
101
-
102
-
103
-
104
-
105
-
106
-
107
-
108
-
109
-
110
-
111
-
112
-
113
-
114
-
115
-
116
-
117
-
118
-
119
-
120
-
121
-
122
-
123
-
124
-
125
-
126
-
127
-
128
-
129
-
130
 |
 |
• 20 • TCF Financial Corporation and Subsidiaries
Results of Operations
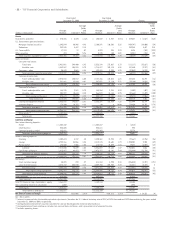
Performance Summary TCF reported diluted earnings
per common share of $1.05 for 2010, compared with $.54
for 2009 and $1.01 for 2008. Net income was $146.6 million
for 2010, compared with $87.1 million for 2009 and $129
million for 2008. Net income for 2009 includes a non-cash
deemed preferred stock dividend of $12 million, or 10 cents
per common share.
Return on average assets was .82% in 2010, compared
with .49% in 2009 and .79% in 2008. Return on average
common equity was 10.36% in 2010, compared with 5.95%
in 2009 and 11.46% in 2008. The effective income tax rate
for 2010 was 36.9%, compared with 34.6% in 2009 and
37.3% in 2008.
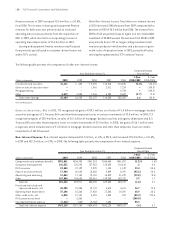
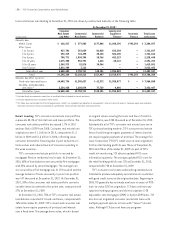
Operating Segment Results RETAIL BANKING — Consisting
of branch banking and retail lending, reported net income
of $93 million for 2010, up from $26.6 million in 2009 as
a result of lower costs of deposits in branch banking and
lower operating expenses. Retail Banking net interest
income for 2010 was $443 million, up 9.9% from $403.2
million for 2009.
The Retail Banking provision for credit losses totaled
$140.6 million in 2010, down 21% from $178 million in
2009. This decrease was primarily due to decreased levels
of provision in excess of net charge-offs in the consumer
real estate portfolio. Refer to the “Item 7. Management’s
Discussion and Analysis of Financial Condition and Results
of Operations — Consolidated Income Statement Analysis
— Provision for Credit Losses” section for further discussion.
Retail Banking non-interest income totaled $409.6
million in 2010, compared with $418 million in 2009. Fees
and service charges were $267.5 million for 2010, down
5.2% from $282.3 million in 2009, primarily due to changes
in customer banking and spending behavior resulting in less
fee income and to a lesser extent, the implementation of
“opt-in” regulations. Card revenues were $111 million for
2010, up 6% from $104.7 million in 2009. The increase in
card revenues was primarily attributable to an increase in
spending per active account. See “Item 7. Management’s
Discussion and Analysis of Financial Condition and Results
of Operations — Consolidated Income Statement Analysis –
Non-Interest Income” for further discussion.
Retail Banking non-interest expense totaled $562.8
million in 2010, down 6% from $599 million in 2009. The
decrease was primarily due to decreased compensation and
employee benefit expense due to headcount reductions,
decreased deposit account premiums and the 2009 FDIC
special assessment.
WHOLESALE BANKING — Consisting of commercial bank-
ing, leasing and equipment finance and inventory finance,
reported net income of $39.5 million for 2010, up 25.2%
from $31.6 million in 2009. Net interest income for 2010
was $251.7 million, up 22% from $206.3 million in 2009,
as a result of an $801 million, or 12.1%, increase in average
interest-earning assets, primarily within the specialty
finance businesses.
The provision for credit losses for this operating segment
totaled $94 million in 2010, up from $78.7 million in 2009.
The increase in the provision for credit losses from 2009 was
primarily due to increased net charge-offs and increased
non-accrual loans in commercial lending.
Wholesale Banking non-interest income totaled $98.7
million in 2010, up $21.5 million from $77.2 million in 2009.
The increase in Wholesale Banking revenues in 2010, was
primarily due to an increase in operating lease revenues
resulting from the acquisition of FNCI in 2009.
Wholesale Banking non-interest expense totaled $191.3
million in 2010, up $35.1 million from $156.2 million in
2009, primarily as a result of increased compensation
expense and operating lease depreciation related to the
FNCI acquisition in 2009 and increased expense for fore-
closed real estate and repossessed assets.
TREASURY SERVICES — Treasury services reported net
income of $16.2 million in 2010, down from $27.4 million in
2009. The $11.2 million decrease was primarily due to the
impact of TCF becoming more asset sensitive, and lower
balances of securities available for sale.
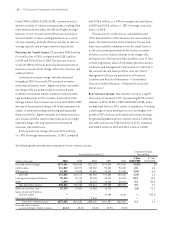
Consolidated Income Statement Analysis
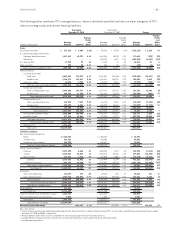
Net Interest Income Net interest income, the differ-
ence between interest earned on loans and leases, invest-
ments and other interest-earning assets (interest income),
and interest paid on deposits and borrowings (interest
expense), represented 56.5% of TCF’s total revenue in
2010, 54.6% in 2009 and 54.4% in 2008. Net interest income
divided by average interest-earning assets is referred to
as the net interest margin, expressed as a percentage. Net
interest income and net interest margin are affected by
changes in prevailing short and long-term interest rates,
loan and deposit pricing strategies and competitive condi-
tions, the volume and the mix of interest-earning assets
and interest-bearing liabilities, the level of non-performing
assets, and the impact of modified loans and leases.