TCF Bank 2010 Annual Report Download - page 45
Download and view the complete annual report
Please find page 45 of the 2010 TCF Bank annual report below. You can navigate through the pages in the report by either clicking on the pages listed below, or by using the keyword search tool below to find specific information within the annual report.-
 1
1 -
2
-
3
-
4
-
5
-
6
-
7
-
8
-
9
-
10
-
11
-
12
-
13
-
14
-
15
-
16
-
17
-
18
-
19
-
20
-
21
-
22
-
23
-
24
-
25
-
26
-
27
-
28
-
29
-
30
-
31
-
32
-
33
-
34
-
 35
35 -
 36
36 -
 37
37 -
 38
38 -
 39
39 -
 40
40 -
 41
41 -
 42
42 -
 43
43 -
 44
44 -
 45
45 -
 46
46 -
 47
47 -
 48
48 -
 49
49 -
 50
50 -
 51
51 -
 52
52 -
 53
53 -
 54
54 -
 55
55 -
56
-
57
-
58
-
59
-
60
-
61
-
62
-
63
-
64
-
65
-
66
-
67
-
68
-
69
-
70
-
71
-
72
-
73
-
74
-
75
-
76
-
77
-
78
-
79
-
80
-
81
-
82
-
83
-
84
-
85
-
86
-
87
-
88
-
89
-
90
-
91
-
92
-
93
-
94
-
95
-
96
-
97
-
98
-
99
-
100
-
101
-
102
-
103
-
104
-
105
-
106
-
107
-
108
-
109
-
110
-
111
-
112
-
113
-
114
-
115
-
116
-
117
-
118
-
119
-
120
-
121
-
122
-
123
-
124
-
125
-
126
-
127
-
128
-
129
-
130
 |
 |

• 29 •
2010 Form 10-K
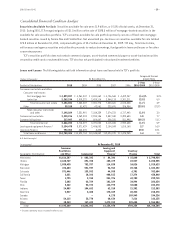
Consolidated Financial Condition Analysis
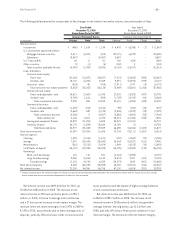
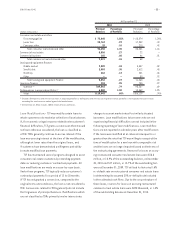
Securities Available for Sale Securities available for sale were $1.9 billion, or 10.5% of total assets, at December 31,
2010. During 2010, TCF recognized gains of $31.5 million on the sale of $598.5 million of mortgage-backed securities in the
available for sale securities portfolio. TCF’s securities available for sale portfolio primarily consists of fixed-rate mortgage-
backed securities issued by Fannie Mae and Freddie Mac. Net unrealized pre-tax losses on securities available for sale totaled
$25.8 million at December 31, 2010, compared with gains of $2.2 million at December 31, 2009. TCF may, from time to time,
sell treasury and agency securities and utilize the proceeds to reduce borrowings, fund growth in loans and leases or for other
corporate purposes.
TCF’s securities portfolio does not contain commercial paper, asset-backed commercial paper or asset-backed securities
secured by credit cards or automobile loans. TCF also has not participated in structured investment vehicles.
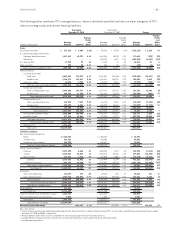
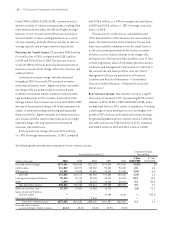
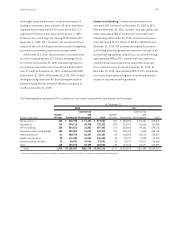
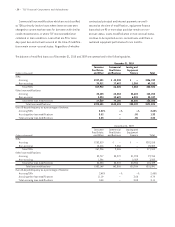
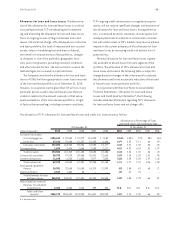
Loans and Leases The following tables set forth information about loans and leases held in TCF’s portfolio.
Compound Annual
(Dollars in thousands) At December 31, Growth Rate
1-Year 5-Year
Portfolio Distribution: 2010 2009 2008 2007 2006 2010/2009 2010/2005
Consumer real estate and other:
Consumer real estate:
First mortgage lien $ 4,893,887 $ 4,961,347 $ 4,881,662 $ 4,706,568 $ 4,409,247 (1.4)% 3.4%
Junior lien 2,262,194 2,319,222 2,420,116 2,344,113 2,101,211 (2.5) 5.0
Total consumer real estate 7,156,081 7,280,569 7,301,778 7,050,681 6,510,458 (1.7) 3.9
Other 39,188 51,422 62,561 223,691 206,984 (23.8) (32.9)
Total consumer real estate
and other 7,195,269 7,331,991 7,364,339 7,274,372 6,717,442 (1.9) 3.0
Commercial real estate 3,328,216 3,269,003 2,984,156 2,557,330 2,390,653 1.8 7.7
Commercial business 317,987 449,516 506,887 558,325 551,995 (29.3) (6.1)
Total commercial 3,646,203 3,718,519 3,491,043 3,115,655 2,942,648 (1.9) 5.9
Leasing and equipment finance (1) 3,154,478 3,071,429 2,486,082 2,104,343 1,818,165 2.7 16.0
Inventory finance 792,354 468,805 4,425 – – 69.0 N.M.
Total loans and leases $14,788,304 $14,590,744 $13,345,889 $12,494,370 $11,478,255 1.4 7.2
N.M. Not Meaningful.
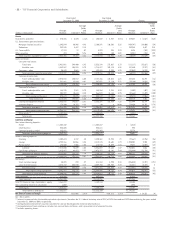
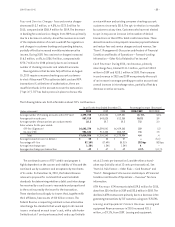
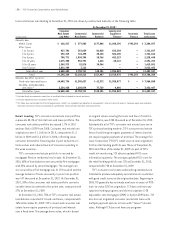
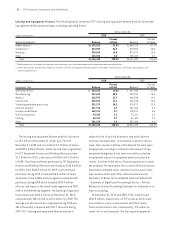
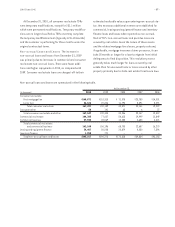
(In thousands) At December 31, 2010
Consumer Leasing and
Real Estate Equipment Inventory
Geographic Distribution: and Other Commercial Finance(1) Finance Total
Minnesota $2,816,387 $ 882,343 $ 84,346 $ 15,848 $ 3,798,924
Illinois 2,180,769 891,780 105,479 22,527 3,200,555
Michigan 1,038,430 752,337 114,830 24,026 1,929,623
Wisconsin 476,683 551,937 54,964 20,768 1,104,352
Colorado 571,446 139,552 44,985 6,701 762,684
California 2,651 18,102 400,813 17,274 438,840
Texas 1,795 2,765 251,376 43,782 299,718
Florida 3,682 62,729 181,229 34,994 282,634
Ohio 3,342 53,373 132,975 33,580 223,270
Indiana 24,089 104,682 62,310 21,302 212,383
New York 3,537 3,400 175,109 28,332 210,378
Canada – – 4,275 189,949 194,224
Arizona 54,115 35,770 68,634 7,616 166,135
Other 18,343 147,433 1,473,153 325,655 1,964,584
Total $7,195,269 $3,646,203 $3,154,478 $792,354 $14,788,304
(1) Excludes operating leases included in other assets.