TCF Bank 2010 Annual Report Download - page 78
Download and view the complete annual report
Please find page 78 of the 2010 TCF Bank annual report below. You can navigate through the pages in the report by either clicking on the pages listed below, or by using the keyword search tool below to find specific information within the annual report.-
 1
1 -
2
-
3
-
4
-
5
-
6
-
7
-
8
-
9
-
10
-
11
-
12
-
13
-
14
-
15
-
16
-
17
-
18
-
19
-
20
-
21
-
22
-
23
-
24
-
25
-
26
-
27
-
28
-
29
-
30
-
31
-
32
-
33
-
34
-
35
-
36
-
37
-
38
-
39
-
40
-
41
-
42
-
43
-
44
-
45
-
46
-
47
-
48
-
49
-
50
-
51
-
52
-
53
-
54
-
55
-
56
-
57
-
58
-
59
-
60
-
61
-
62
-
63
-
64
-
65
-
66
-
67
-
 68
68 -
 69
69 -
 70
70 -
 71
71 -
 72
72 -
 73
73 -
 74
74 -
 75
75 -
 76
76 -
 77
77 -
 78
78 -
 79
79 -
 80
80 -
 81
81 -
 82
82 -
 83
83 -
 84
84 -
 85
85 -
 86
86 -
 87
87 -
 88
88 -
89
-
90
-
91
-
92
-
93
-
94
-
95
-
96
-
97
-
98
-
99
-
100
-
101
-
102
-
103
-
104
-
105
-
106
-
107
-
108
-
109
-
110
-
111
-
112
-
113
-
114
-
115
-
116
-
117
-
118
-
119
-
120
-
121
-
122
-
123
-
124
-
125
-
126
-
127
-
128
-
129
-
130
 |
 |

• 62 • TCF Financial Corporation and Subsidiaries
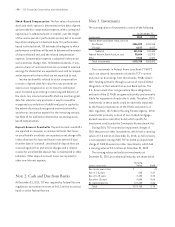
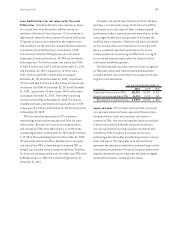
During the year ended December 31, 2010, TCF sold
$10.7 million of minimum lease payment receivables,
receiving cash of $10.7 million and recognizing a loss of $25
thousand. The retained residual values reported within the
Statements of Financial Condition at December 31, 2010
totaled $183 thousand.
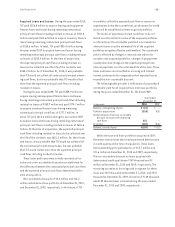
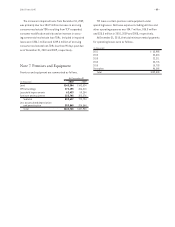
Future minimum lease payments receivable for direct
financing, sales-type leases and operating leases as of
December 31, 2010, are as follows.
(In thousands) Total
2011 $ 910,363
2012 636,486
2013 408,759
2014 207,209
2015 77,826
Thereafter 26,290
Total $2,266,933
The aggregate amount of loans to non-management
directors of TCF and their related interests was $7.4
million and $7.5 million at December 31, 2010 and 2009,
respectively. During 2010, $2.5 million in new loans were
made and $2.7 million of loans were repaid. All loans to
outside directors and their related interests were made
in the ordinary course of business on normal credit terms,
including interest rates and collateral, as those prevailing
at the time for comparable transactions with unrelated
persons. The aggregate amount of loans to executive
officers of TCF was $97 thousand at December 31, 2010 and
2009. In the opinion of management, the above mentioned
loans to outside directors and their related interests and
executive officers do not represent more than a normal risk
of collection.
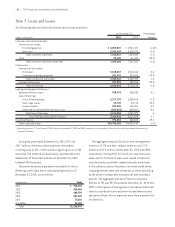
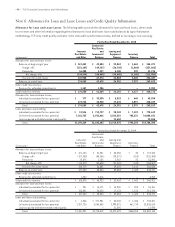
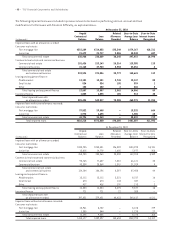
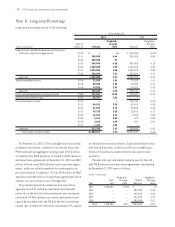
Note 5. Loans and Leases
The following table sets forth information about loans and leases.
At December 31, Percentage
(Dollars in thousands) 2010 2009 Change
Consumer real estate and other:
Consumer real estate:
First mortgage lien $ 4,893,887 $ 4,961,347 (1.4)%
Junior lien 2,262,194 2,319,222 (2.5)
Total consumer real estate 7,156,081 7,280,569 (1.7)
Other 39,188 51,422 (23.8)
Total consumer real estate and other 7,195,269 7,331,991 (1.9)
Commercial:
Commercial real estate:
Permanent 3,125,837 3,016,518 3.6
Construction and development 202,379 252,485 (19.8)
Total commercial real estate 3,328,216 3,269,003 1.8
Commercial business 317,987 449,516 (29.3)
Total commercial 3,646,203 3,718,519 (1.9)
Leasing and equipment finance: (1)
Equipment finance loans 939,474 868,830 8.1
Lease financings:
Direct financing leases 2,277,753 2,305,945 (1.2)
Sales-type leases 29,728 24,714 20.3
Lease residuals 109,555 106,391 3.0
Unearned income and deferred lease costs (202,032) (234,451) 13.8
Total lease financings 2,215,004 2,202,599 .6
Total leasing and equipment finance 3,154,478 3,071,429 2.7
Inventory finance 792,354 468,805 69.0
Total loans and leases $14,788,304 $14,590,744 1.4 %
(1) Operating leases of $77.4 million and $105.9 million at December 31, 2010 and 2009, respectively, are included in Other Assets on the Consolidated Statements of
Financial Condition.