TCF Bank 2010 Annual Report Download - page 88
Download and view the complete annual report
Please find page 88 of the 2010 TCF Bank annual report below. You can navigate through the pages in the report by either clicking on the pages listed below, or by using the keyword search tool below to find specific information within the annual report.-
 1
1 -
2
-
3
-
4
-
5
-
6
-
7
-
8
-
9
-
10
-
11
-
12
-
13
-
14
-
15
-
16
-
17
-
18
-
19
-
20
-
21
-
22
-
23
-
24
-
25
-
26
-
27
-
28
-
29
-
30
-
31
-
32
-
33
-
34
-
35
-
36
-
37
-
38
-
39
-
40
-
41
-
42
-
43
-
44
-
45
-
46
-
47
-
48
-
49
-
50
-
51
-
52
-
53
-
54
-
55
-
56
-
57
-
58
-
59
-
60
-
61
-
62
-
63
-
64
-
65
-
66
-
67
-
68
-
69
-
70
-
71
-
72
-
73
-
74
-
75
-
76
-
77
-
 78
78 -
 79
79 -
 80
80 -
 81
81 -
 82
82 -
 83
83 -
 84
84 -
 85
85 -
 86
86 -
 87
87 -
 88
88 -
 89
89 -
 90
90 -
 91
91 -
 92
92 -
 93
93 -
 94
94 -
 95
95 -
 96
96 -
 97
97 -
 98
98 -
99
-
100
-
101
-
102
-
103
-
104
-
105
-
106
-
107
-
108
-
109
-
110
-
111
-
112
-
113
-
114
-
115
-
116
-
117
-
118
-
119
-
120
-
121
-
122
-
123
-
124
-
125
-
126
-
127
-
128
-
129
-
130
 |
 |

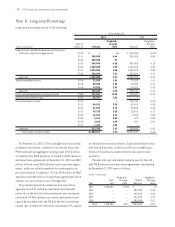
• 72 • TCF Financial Corporation and Subsidiaries
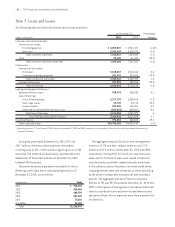
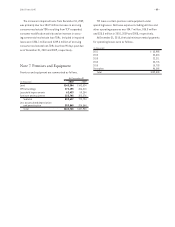
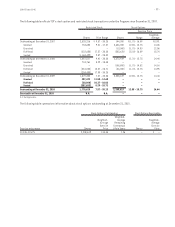
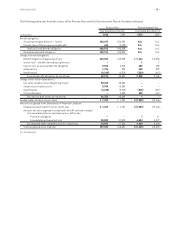
Note 11. Long-term Borrowings
Long-term borrowings consist of the following.
At December 31,
2010 2009
Weighted- Weighted-
Year of Average Average
(Dollars in thousands) Maturity Amount Rate Amount Rate
Federal Home Loan Bank advances and securities
sold under repurchase agreements 2010 $ – –% $ 100,000 6.02%
2011 300,000 4.64 300,000 4.64
2013 400,000 .97 – –
2015 900,000 4.18 900,000 4.18
2016 1,100,000 4.49 1,100,000 4.49
2017 1,250,000 4.60 1,250,000 4.60
2018 300,000 3.51 300,000 3.51
Subtotal 4,250,000 4.07 3,950,000 4.43
Subordinated bank notes 2014 71,020 1.96 71,020 1.91
2015 50,000 1.89 49,969 5.37
2016 74,589 5.63 74,522 5.63
Subtotal 195,609 3.34 195,511 4.21
Junior subordinated notes (trust preferred) 2068 111,061 12.28 110,441 11.20
Senior unsecured term note 2012 89,787 3.83 – –
Discounted lease rentals 2010 – – 108,795 5.42
2011 84,101 5.30 69,420 5.55
2012 61,829 5.31 43,968 5.62
2013 39,155 5.28 25,657 5.72
2014 16,463 5.12 6,500 5.84
2015 5,211 5.02 402 5.89
2016 3,818 4.98 201 5.91
2017 1,787 4.98 – –
Subtotal 212,364 5.27 254,943 5.53
Total long-term borrowings $4,858,821 4.27 $4,510,895 4.65
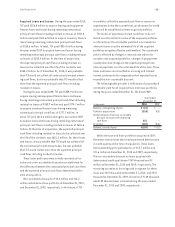
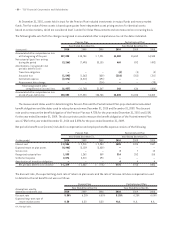
At December 31, 2010, TCF has pledged loans secured by
residential real estate, commercial real estate loans and
FHLB stock with an aggregate carrying value of $7.4 billion
as collateral for FHLB advances. Included in FHLB advances
and repurchase agreements at December 31, 2010 are $300
million of fixed-rate FHLB advances and repurchase agree-
ments, which are callable quarterly by counterparties at
par until maturity. In addition, TCF has $200 million of FHLB
advances and $200 million of repurchase agreements which
contain one-time call provisions through 2011.
The probability that the advances and repurchase
agreements will be called by counterparties depends
primarily on the level of related interest rates during the
call period. If FHLB advances are called, replacement fund-
ing will be available from the FHLB at the then-prevailing
market rate of interest for the term selected by TCF, subject
to standard terms and conditions. Subordinated bank notes
with stated maturities in 2014 and 2015 are callable quar-
terly by TCF and have variable interest rates which reset
quarterly.
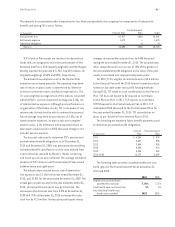
The next call year and stated maturity year for the call-
able FHLB advances and repurchase agreements outstanding
at December 31, 2010 were as follows.
(Dollars in thousands)
Weighted- Weighted-
Next Average Stated Average
Year Call Rate Maturity Rate
2011 $700,000 3.92% $ – –%
2015 – – 200,000 3.88
2016 – – 100,000 4.82
2017 – – 100,000 4.37
2018 – – 300,000 3.51
Total $700,000 3.92 $700,000 3.92