TCF Bank 2010 Annual Report Download - page 102
Download and view the complete annual report
Please find page 102 of the 2010 TCF Bank annual report below. You can navigate through the pages in the report by either clicking on the pages listed below, or by using the keyword search tool below to find specific information within the annual report.-
 1
1 -
2
-
3
-
4
-
5
-
6
-
7
-
8
-
9
-
10
-
11
-
12
-
13
-
14
-
15
-
16
-
17
-
18
-
19
-
20
-
21
-
22
-
23
-
24
-
25
-
26
-
27
-
28
-
29
-
30
-
31
-
32
-
33
-
34
-
35
-
36
-
37
-
38
-
39
-
40
-
41
-
42
-
43
-
44
-
45
-
46
-
47
-
48
-
49
-
50
-
51
-
52
-
53
-
54
-
55
-
56
-
57
-
58
-
59
-
60
-
61
-
62
-
63
-
64
-
65
-
66
-
67
-
68
-
69
-
70
-
71
-
72
-
73
-
74
-
75
-
76
-
77
-
78
-
79
-
80
-
81
-
82
-
83
-
84
-
85
-
86
-
87
-
88
-
89
-
90
-
91
-
 92
92 -
 93
93 -
 94
94 -
 95
95 -
 96
96 -
 97
97 -
 98
98 -
 99
99 -
 100
100 -
 101
101 -
 102
102 -
 103
103 -
 104
104 -
 105
105 -
 106
106 -
 107
107 -
 108
108 -
 109
109 -
 110
110 -
 111
111 -
 112
112 -
113
-
114
-
115
-
116
-
117
-
118
-
119
-
120
-
121
-
122
-
123
-
124
-
125
-
126
-
127
-
128
-
129
-
130
 |
 |

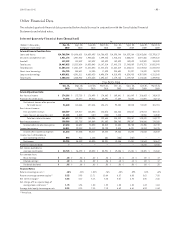
• 86 • TCF Financial Corporation and Subsidiaries
The change in the financial assets carried at fair value
using Company Determined Market Prices from $5.3 million
at December 31, 2009, to $2.6 million at December 31,
2010, was the result of impairment charges totaling $2.1
million recorded through gains on securities, net, decreases
in fair values of $417 thousand recorded through other
comprehensive income and reductions due to principal
paydowns of $90 thousand.
The following is a description of valuation methodologies
used for assets measured on a non-recurring basis.
Loans Impaired loans for which repayment of the loan
is expected to be provided solely by the value of the
underlying collateral are considered collateral dependent
and are valued based on the fair value of such collateral.
Long-lived Assets Held for Sale Long-lived assets
held for sale include real estate owned and repossessed
and returned equipment. The fair value of real estate
owned is based on independent full appraisals, real
estate broker’s price opinions, or automated valuation
methods, less estimated selling costs. Certain properties
require assumptions that are not observable in an active
market in the determination of fair value. The fair value of
repossessed and returned equipment is based on available
pricing guides, auction results or price opinions, less
estimated selling costs. Assets that are acquired through
foreclosure, repossession or return are initially recorded
at the lower of the loan or lease carrying amount or fair
value less estimated selling costs at the time of transfer to
real estate owned or repossessed and returned equipment.
Long-lived assets held for sale were written down $20
million, which is included in foreclosed real estate and
repossessed assets, net expense, during the year ended
December 31, 2010.
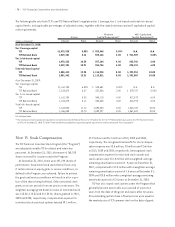
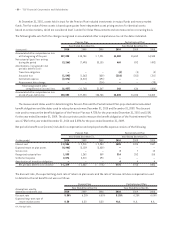
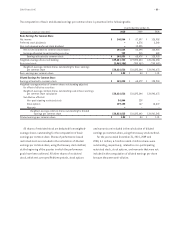
The table below presents the balances of assets measured at fair value on a non-recurring basis at December 31, 2010.
Readily Observable Company
Available Market Determined Total at
(In thousands) Market Prices(1) Prices(2) Market Prices(3) Fair Value
Loans (4) $ – $ – $ 42,683 $ 42,683
Real estate owned (5) – – 127,295 127,295
Repossessed and returned equipment (5) – 5,731 1,180 6,911
Investments (6) – – 4,296 4,296
Total $ – $ 5,731 $175,454 $181,185
At December 31, 2009:
Loans (4) $ – $ – $ 62,794 $ 62,794
Real estate owned (5) – – 71,272 71,272
Repossessed and returned equipment (5) – 14,861 527 15,388
Total $ – $14,861 $134,593 $149,454
(1) Considered Level 1 under ASC 820, Fair Value Measurements and Disclosures.
(2) Considered Level 2 under ASC 820, Fair Value Measurements and Disclosures.
(3) Considered Level 3 under ASC 820, Fair Value Measurements and Disclosures, and is based on valuation models that use significant assumptions that are not observable in
an active market.
(4) Represents the carrying value of loans for which adjustments are based on the appraisal value of the collateral.
(5) Amounts do not include assets held at cost at December 31, 2010.
(6) Represents the carrying value of other investments which were recorded at fair value determined by using quoted prices, when available, and incorporating results of
internal pricing techniques and observable market information during the year ended December 31, 2010.