TCF Bank 2010 Annual Report Download - page 60
Download and view the complete annual report
Please find page 60 of the 2010 TCF Bank annual report below. You can navigate through the pages in the report by either clicking on the pages listed below, or by using the keyword search tool below to find specific information within the annual report.-
 1
1 -
2
-
3
-
4
-
5
-
6
-
7
-
8
-
9
-
10
-
11
-
12
-
13
-
14
-
15
-
16
-
17
-
18
-
19
-
20
-
21
-
22
-
23
-
24
-
25
-
26
-
27
-
28
-
29
-
30
-
31
-
32
-
33
-
34
-
35
-
36
-
37
-
38
-
39
-
40
-
41
-
42
-
43
-
44
-
45
-
46
-
47
-
48
-
49
-
 50
50 -
 51
51 -
 52
52 -
 53
53 -
 54
54 -
 55
55 -
 56
56 -
 57
57 -
 58
58 -
 59
59 -
 60
60 -
 61
61 -
 62
62 -
 63
63 -
 64
64 -
 65
65 -
 66
66 -
 67
67 -
 68
68 -
 69
69 -
 70
70 -
71
-
72
-
73
-
74
-
75
-
76
-
77
-
78
-
79
-
80
-
81
-
82
-
83
-
84
-
85
-
86
-
87
-
88
-
89
-
90
-
91
-
92
-
93
-
94
-
95
-
96
-
97
-
98
-
99
-
100
-
101
-
102
-
103
-
104
-
105
-
106
-
107
-
108
-
109
-
110
-
111
-
112
-
113
-
114
-
115
-
116
-
117
-
118
-
119
-
120
-
121
-
122
-
123
-
124
-
125
-
126
-
127
-
128
-
129
-
130
 |
 |
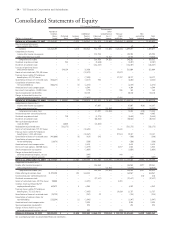
• 44 • TCF Financial Corporation and Subsidiaries
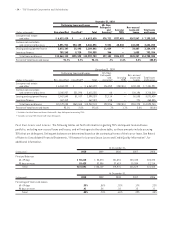
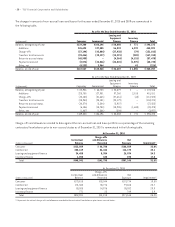
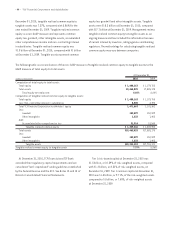
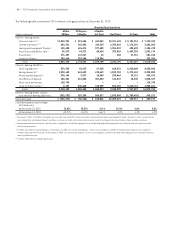
The following table is a reconciliation of the non-GAAP measure of tangible realized common equity to tangible assets to the
GAAP measure of total equity to total assets.
At December 31,
(Dollars in thousands) 2010 2009
Computation of total equity to total assets:
Total equity $ 1,480,163 $ 1,179,755
Total assets 18,465,025 17,885,175
Total equity to total assets 8.02% 6.60%
Computation of tangible realized common equity to tangible assets:
Total equity $ 1,480,163 $ 1,179,755
Less: Non-controlling interest in subsidiaries 8,500 4,393
Total TCF Financial Corporation stockholders’ equity 1,471,663 1,175,362
Less:
Goodwill 152,599 152,599
Other intangibles 1,232 1,405
Add:
Accumulated other comprehensive loss 31,514 18,545
Tangible realized common equity $ 1,349,346 $ 1,039,903
Total assets $18,465,025 $17,885,175
Less:
Goodwill 152,599 152,599
Other intangibles 1,232 1,405
Tangible assets $18,311,194 $17,731,171
Tangible realized common equity to tangible assets 7.37% 5.86%
December 31, 2010, tangible realized common equity to
tangible assets was 7.37%, compared with 5.86% for the
year ended December 31, 2009. Tangible realized common
equity is a non-GAAP measure and represents common
equity less goodwill, other intangible assets, accumulated
other comprehensive income and non-controlling interest
in subsidiaries. Tangible realized common equity was
$1.3 billion at December 31, 2010, compared with $1 billion
at December 31, 2009. Tangible assets represent common
equity less goodwill and other intangible assets. Tangible
assets were $18.3 billion at December 31, 2010, compared
with $17.7 billion at December 31, 2009. Management reviews
tangible realized common equity to tangible assets as an
ongoing measure and has included this information because
of current interest by investors, rating agencies and banking
regulators. The methodology for calculating tangible realized
common equity may vary between companies.
At December 31, 2010, TCF Financial and TCF Bank
exceeded their regulatory capital requirements and are
considered “well-capitalized” under guidelines established
by the Federal Reserve and the OCC. See Notes 13 and 14 of
Notes to Consolidated Financial Statements.
Tier 1 risk-based capital at December 31, 2010 was
$1.5 billion, or 10.59% of risk-weighted assets, compared
with $1.2 billion, or 8.52% of risk-weighted assets, at
December 31, 2009. Tier 1 common capital at December 31,
2010 was $1.4 billion, or 9.71%, of the risk-weighted assets
compared to $1 billion, or 7.65%, of risk-weighted assets
at December 31, 2009.