TCF Bank 2010 Annual Report Download - page 69
Download and view the complete annual report
Please find page 69 of the 2010 TCF Bank annual report below. You can navigate through the pages in the report by either clicking on the pages listed below, or by using the keyword search tool below to find specific information within the annual report.-
 1
1 -
2
-
3
-
4
-
5
-
6
-
7
-
8
-
9
-
10
-
11
-
12
-
13
-
14
-
15
-
16
-
17
-
18
-
19
-
20
-
21
-
22
-
23
-
24
-
25
-
26
-
27
-
28
-
29
-
30
-
31
-
32
-
33
-
34
-
35
-
36
-
37
-
38
-
39
-
40
-
41
-
42
-
43
-
44
-
45
-
46
-
47
-
48
-
49
-
50
-
51
-
52
-
53
-
54
-
55
-
56
-
57
-
58
-
 59
59 -
 60
60 -
 61
61 -
 62
62 -
 63
63 -
 64
64 -
 65
65 -
 66
66 -
 67
67 -
 68
68 -
 69
69 -
 70
70 -
 71
71 -
 72
72 -
 73
73 -
 74
74 -
 75
75 -
 76
76 -
 77
77 -
 78
78 -
 79
79 -
80
-
81
-
82
-
83
-
84
-
85
-
86
-
87
-
88
-
89
-
90
-
91
-
92
-
93
-
94
-
95
-
96
-
97
-
98
-
99
-
100
-
101
-
102
-
103
-
104
-
105
-
106
-
107
-
108
-
109
-
110
-
111
-
112
-
113
-
114
-
115
-
116
-
117
-
118
-
119
-
120
-
121
-
122
-
123
-
124
-
125
-
126
-
127
-
128
-
129
-
130
 |
 |

• 53 •
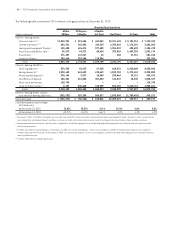
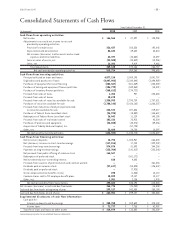
2010 Form 10-K
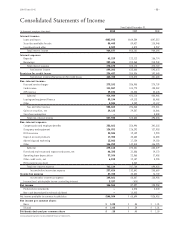
Consolidated Statements of Income
Year Ended December 31,
(In thousands, except per-share data) 2010 2009 2008
Interest income:
Loans and leases $883,923 $864,384 $847,512
Securities available for sale 80,445 89,427 110,946
Investments and other 5,509 4,370 5,937
Total interest income 969,877 958,181 964,395
Interest expense:
Deposits 61,229 122,112 156,774
Borrowings 209,446 203,063 213,948
Total interest expense 270,675 325,175 370,722
Net interest income 699,202 633,006 593,673
Provision for credit losses 236,437 258,536 192,045
Net interest income after provision for credit losses 462,765 374,470 401,628
Non-interest income:
Fees and service charges 273,181 286,908 270,739
Card revenue 111,067 104,770 103,082
ATM revenue 29,836 30,438 32,645
Subtotal 414,084 422,116 406,466
Leasing and equipment finance 89,194 69,113 55,488
Other 5,584 5,239 12,107
Fees and other revenue 508,862 496,468 474,061
Gains on securities, net 29,123 29,387 16,066
Visa share redemption – – 8,308
Total non-interest income 537,985 525,855 498,435
Non-interest expense:
Compensation and employee benefits 352,861 356,996 341,203
Occupancy and equipment 126,551 126,292 127,953
FDIC insurance 23,584 19,109 2,990
Deposit account premiums 17,304 30,682 16,888
Advertising and marketing 13,062 17,134 19,150
Other 146,253 142,818 146,295
Subtotal 679,615 693,031 654,479
Foreclosed real estate and repossessed assets, net 40,385 31,886 19,170
Operating lease depreciation 37,106 22,368 17,458
Other credit costs, net 6,018 12,137 3,296
FDIC special assessment – 8,362 –
Total non-interest expense 763,124 767,784 694,403
Income before income tax expense 237,626 132,541 205,660
Income tax expense 87,765 45,854 76,702
Income after income tax expense 149,861 86,687 128,958
Income (loss) attributable to non-controlling interest 3,297 (410) –
Net income 146,564 87,097 128,958
Preferred stock dividends – 6,378 2,540
Non-cash deemed preferred stock dividend – 12,025 –
Net income available to common stockholders $146,564 $ 68,694 $126,418
Net income per common share:
Basic $ 1.05 $ .54 $ 1.01
Diluted $ 1.05 $ .54 $ 1.01
Dividends declared per common share $ .20 $ .40 $ 1.00
See accompanying notes to consolidated financial statements.