TCF Bank 2010 Annual Report Download - page 81
Download and view the complete annual report
Please find page 81 of the 2010 TCF Bank annual report below. You can navigate through the pages in the report by either clicking on the pages listed below, or by using the keyword search tool below to find specific information within the annual report.-
 1
1 -
2
-
3
-
4
-
5
-
6
-
7
-
8
-
9
-
10
-
11
-
12
-
13
-
14
-
15
-
16
-
17
-
18
-
19
-
20
-
21
-
22
-
23
-
24
-
25
-
26
-
27
-
28
-
29
-
30
-
31
-
32
-
33
-
34
-
35
-
36
-
37
-
38
-
39
-
40
-
41
-
42
-
43
-
44
-
45
-
46
-
47
-
48
-
49
-
50
-
51
-
52
-
53
-
54
-
55
-
56
-
57
-
58
-
59
-
60
-
61
-
62
-
63
-
64
-
65
-
66
-
67
-
68
-
69
-
70
-
 71
71 -
 72
72 -
 73
73 -
 74
74 -
 75
75 -
 76
76 -
 77
77 -
 78
78 -
 79
79 -
 80
80 -
 81
81 -
 82
82 -
 83
83 -
 84
84 -
 85
85 -
 86
86 -
 87
87 -
 88
88 -
 89
89 -
 90
90 -
 91
91 -
92
-
93
-
94
-
95
-
96
-
97
-
98
-
99
-
100
-
101
-
102
-
103
-
104
-
105
-
106
-
107
-
108
-
109
-
110
-
111
-
112
-
113
-
114
-
115
-
116
-
117
-
118
-
119
-
120
-
121
-
122
-
123
-
124
-
125
-
126
-
127
-
128
-
129
-
130
 |
 |

• 65 •
2010 Form 10-K
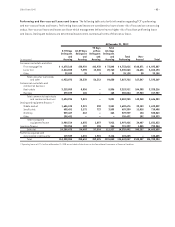
At December 31, 2010(1)
90 Days Total
0-59 Days 60-89 Days or More 60+ Days
Delinquent Delinquent Delinquent Delinquent
and and and and Total Non-
(In thousands) Accruing Accruing Accruing Accruing Performing Accrual Total
Consumer real estate and other:
First mortgage lien $ 4,679,168 $30,910 $42,938 $ 73,848 $ 4,753,016 $140,871 $ 4,893,887
Junior lien 2,214,805 7,398 13,365 20,763 2,235,568 26,626 2,262,194
Other 39,099 30 9 39 39,138 50 39,188
Total consumer real estate
and other 6,933,072 38,338 56,312 94,650 7,027,722 167,547 7,195,269
Commercial real estate and
commercial business:
Real estate 3,215,055 8,856 – 8,856 3,223,911 104,305 3,328,216
Business 279,879 165 – 165 280,044 37,943 317,987
Total commercial real estate
and commercial business 3,494,934 9,021 – 9,021 3,503,955 142,248 3,646,203
Leasing and equipment finance:(1)
Middle market 1,606,125 3,221 330 3,551 1,609,676 23,153 1,632,829
Small ticket 695,491 3,172 727 3,899 699,390 11,018 710,408
Winthrop 529,467 462 – 462 529,929 134 530,063
Other 158,431 – – – 158,431 102 158,533
Total leasing and
equipment finance 2,989,514 6,855 1,057 7,912 2,997,426 34,407 3,031,833
Inventory finance 790,955 189 155 344 791,299 1,055 792,354
Subtotal 14,208,475 54,403 57,524 111,927 14,320,402 345,257 14,665,659
Portfolios acquired with
deteriorated credit quality 119,529 1,215 1,901 3,116 122,645 – 122,645
Total $14,328,004 $55,618 $59,425 $115,043 $14,443,047 $345,257 $14,788,304
(1) Operating leases of $77.4 million at December 31, 2010 are included in Other Assets on the Consolidated Statements of Financial Condition.
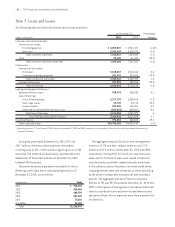
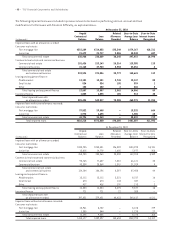
Performing and Non-accrual Loans and Leases The following table sets forth information regarding TCF’s performing
and non-accrual loans and leases. Performing loans and leases are considered to have a lower risk of loss and are on accruing
status. Non-accrual loans and leases are those which management believes have a higher risk of loss than performing loans
and leases. Delinquent balances are determined based on the contractual terms of the loan or lease.