TCF Bank 2010 Annual Report Download - page 93
Download and view the complete annual report
Please find page 93 of the 2010 TCF Bank annual report below. You can navigate through the pages in the report by either clicking on the pages listed below, or by using the keyword search tool below to find specific information within the annual report.-
 1
1 -
2
-
3
-
4
-
5
-
6
-
7
-
8
-
9
-
10
-
11
-
12
-
13
-
14
-
15
-
16
-
17
-
18
-
19
-
20
-
21
-
22
-
23
-
24
-
25
-
26
-
27
-
28
-
29
-
30
-
31
-
32
-
33
-
34
-
35
-
36
-
37
-
38
-
39
-
40
-
41
-
42
-
43
-
44
-
45
-
46
-
47
-
48
-
49
-
50
-
51
-
52
-
53
-
54
-
55
-
56
-
57
-
58
-
59
-
60
-
61
-
62
-
63
-
64
-
65
-
66
-
67
-
68
-
69
-
70
-
71
-
72
-
73
-
74
-
75
-
76
-
77
-
78
-
79
-
80
-
81
-
82
-
 83
83 -
 84
84 -
 85
85 -
 86
86 -
 87
87 -
 88
88 -
 89
89 -
 90
90 -
 91
91 -
 92
92 -
 93
93 -
 94
94 -
 95
95 -
 96
96 -
 97
97 -
 98
98 -
 99
99 -
 100
100 -
 101
101 -
 102
102 -
 103
103 -
104
-
105
-
106
-
107
-
108
-
109
-
110
-
111
-
112
-
113
-
114
-
115
-
116
-
117
-
118
-
119
-
120
-
121
-
122
-
123
-
124
-
125
-
126
-
127
-
128
-
129
-
130
 |
 |
• 77 •
2010 Form 10-K
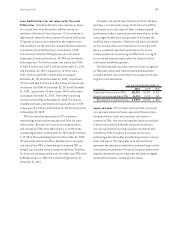
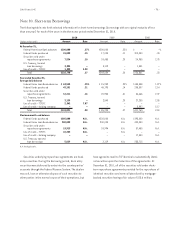
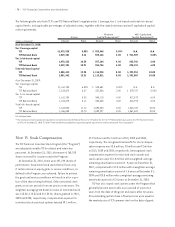
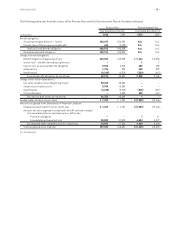
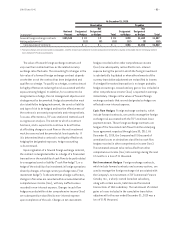
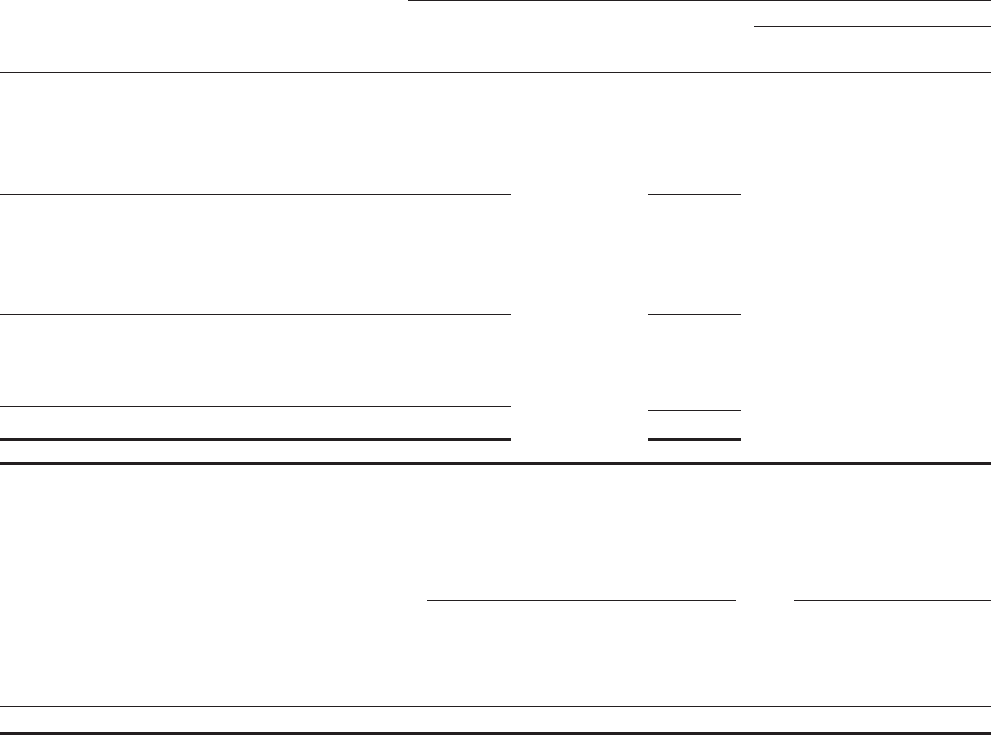
The following table reflects TCF’s stock option and restricted stock transactions under the Program since December 31, 2007.
Restricted Stock Stock Options
Exercise Price
Weighted-
Shares Price Range Shares Range Average
Outstanding at December 31, 2007 2,525,216 $ 9.87 - 30.28 144,050 $11.78 - 16.09 $13.91
Granted 753,650 9.41 - 17.37 2,626,000 12.85 - 15.75 14.65
Exercised – – (13,000) 11.78 - 14.30 12.56
Forfeited (222,850) 17.37 - 30.28 (383,631) 15.03 - 16.09 15.74
Vested (1,168,499) 9.87 - 28.02 – – –
Outstanding at December 31, 2008 1,887,517 9.41 - 30.28 2,373,419 11.78 - 15.75 14.44
Granted 718,761 8.29 - 13.43 – – –
Exercised – – (108,800) 11.78 - 14.52 14.14
Forfeited (481,000) 10.37 - 28.71 (56,000) 11.78 - 15.75 14.95
Vested (254,433) 17.33 - 30.28 – – –
Outstanding at December 31, 2009 1,870,845 7.57 - 30.28 2,208,619 12.85 - 15.75 14.44
Granted 307,433 11.50 - 14.60 – – –
Forfeited (20,000) 10.37 - 28.02 – – –
Vested (387,653) 8.29 - 28.71 – –
Outstanding at December 31, 2010 1,770,625 7.57 - 30.13 2,208,619 12.85 - 15.75 14.44
Exercisable at December 31, 2010 N.A. N.A. – – –
N.A. Not Applicable.
The following table summarizes information about stock options outstanding at December 31, 2010.
Stock Options Outstanding Stock Options Exercisable
Weighted-
Weighted- Average Weighted-
Average Remaining Average
Exercise Contractual Exercise
Exercise price range Shares Price Life in Years Shares Price
$12.85-$15.75 2,208,619 $14.44 7.26 – $ –