Overstock.com 2009 Annual Report Download - page 97
Download and view the complete annual report
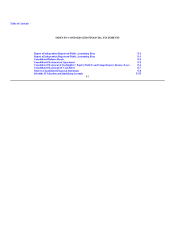
Please find page 97 of the 2009 Overstock.com annual report below. You can navigate through the pages in the report by either clicking on the pages listed below, or by using the keyword search tool below to find specific information within the annual report.-
 1
1 -
2
-
3
-
4
-
5
-
6
-
7
-
8
-
9
-
10
-
11
-
12
-
13
-
14
-
15
-
16
-
17
-
18
-
19
-
20
-
21
-
22
-
23
-
24
-
25
-
26
-
27
-
28
-
29
-
30
-
31
-
32
-
33
-
34
-
35
-
36
-
37
-
38
-
39
-
40
-
41
-
42
-
43
-
44
-
45
-
46
-
47
-
48
-
49
-
50
-
51
-
52
-
53
-
54
-
55
-
56
-
57
-
58
-
59
-
60
-
61
-
62
-
63
-
64
-
65
-
66
-
67
-
68
-
69
-
70
-
71
-
72
-
73
-
74
-
75
-
76
-
77
-
78
-
79
-
80
-
81
-
82
-
83
-
84
-
85
-
86
-
 87
87 -
 88
88 -
 89
89 -
 90
90 -
 91
91 -
 92
92 -
 93
93 -
 94
94 -
 95
95 -
 96
96 -
 97
97 -
 98
98 -
 99
99 -
 100
100 -
 101
101 -
 102
102 -
 103
103 -
 104
104 -
 105
105 -
 106
106 -
 107
107 -
108
-
109
-
110
-
111
-
112
-
113
-
114
-
115
-
116
-
117
-
118
-
119
-
120
-
121
-
122
-
123
-
124
-
125
-
126
-
127
-
128
-
129
-
130
-
131
-
132
-
133
-
134
-
135
-
136
-
137
-
138
-
139
-
140
-
141
-
142
-
143
-
144
-
145
-
146
-
147
-
148
-
149
-
150
-
151
-
152
-
153
-
154
-
155
-
156
-
157
-
158
-
159
-
160
-
161
-
162
-
163
-
164
-
165
-
166
-
167
-
168
 |
 |
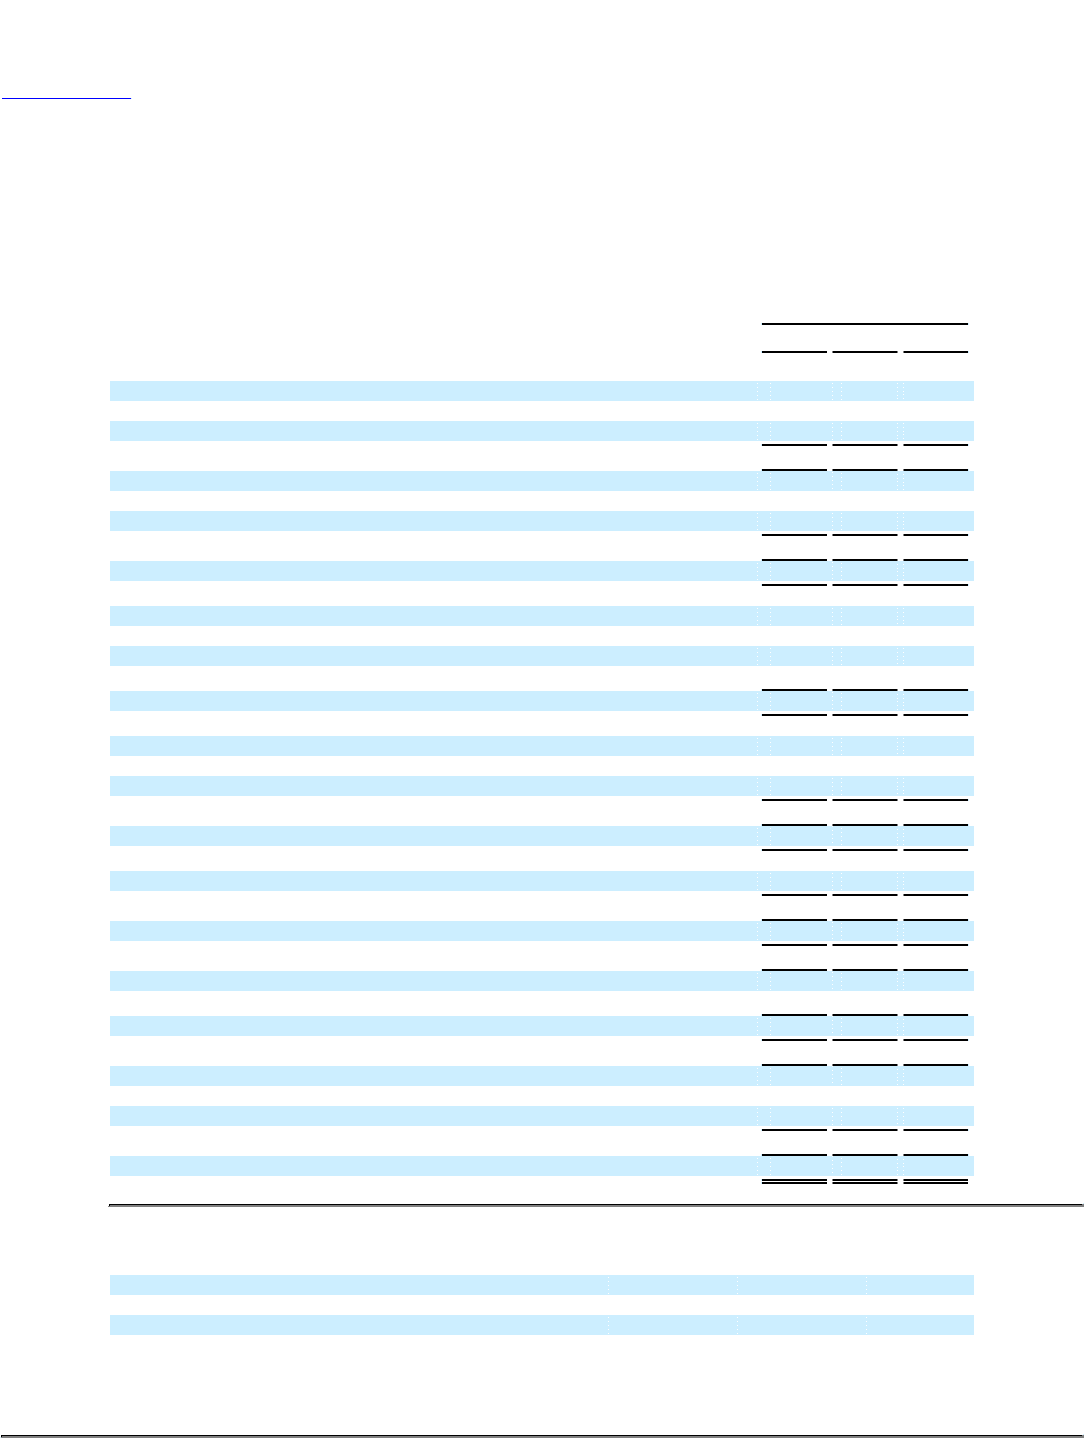
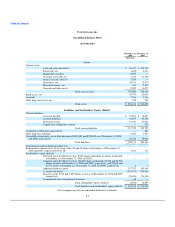
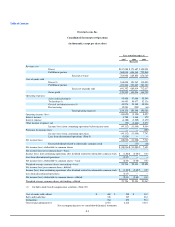
Table of Contents
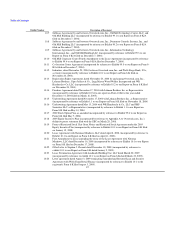
Overstock.com, Inc.
Consolidated Statements of Operations
(in thousands, except per share data)
Year ended December 31
2007 2008 2009
(Restated)
Revenue, net
Direct $197,088 $173,687 $150,901
Fulfillment partner 568,814 656,163 725,868
Total net revenue 765,902 829,850 876,769
Cost of goods sold
Direct(1) 168,008 153,967 130,890
Fulfillment partner 473,344 531,647 581,127
Total cost of goods sold 641,352 685,614 712,017
Gross profit 124,550 144,236 164,752
Operating expenses:
Sales and marketing(1) 55,458 57,668 55,549
Technology(1) 59,453 56,677 52,336
General and administrative(1) 41,976 39,348 48,906
Restructuring 12,283 (299) (66)
Total operating expenses 169,170 153,394 156,725
Operating income (loss) (44,620) (9,158) 8,027
Interest income 4,788 3,163 170
Interest expense (4,188) (3,565) (3,470)
Other income (expense), net (92) (1,446) 3,277
Income (loss) from continuing operations before income taxes (44,112) (11,006) 8,004
Provision for income taxes — — (257)
Income (loss) from continuing operations (44,112) (11,006) 7,747
Loss from discontinued operations (Note 5) (3,924) — —
Net income (loss) (48,036) (11,006) 7,747
Deemed dividend related to redeemable common stock — (77) (48)
Net income (loss) attributable to common shares $ (48,036)$ (11,083)$ 7,699
Net income (loss) per common share—basic:
Income (loss) from continuing operations after dividend related to redeemable common stock $ (1.86)$ (0.48)$ 0.34
Loss from discontinued operations (0.17) — —
Net income (loss) attributable to common shares—basic (2.03) (0.48) 0.34
Weighted average common shares outstanding—basic 23,704 22,901 22,821
Net income (loss) per common share—diluted:
Income (loss) from continuing operations after dividend related to redeemable common stock $ (1.86)$ (0.48)$ 0.33
Loss from discontinued operations (0.17) — —
Net income (loss) attributable to common shares—diluted (2.03) (0.48) 0.33
Weighted average common shares outstanding—diluted 23,704 22,901 23,067
Includes stock-based compensation as follows (Note 20):(1)
Cost of goods sold—direct $ 460 $ 198 $ 167
Sales and marketing 336 347 634
Technology 764 870 961
General and administrative 2,601 2,216 3,023
See accompanying notes to consolidated financial statements.
F-5