Overstock.com 2009 Annual Report Download - page 75
Download and view the complete annual report
Please find page 75 of the 2009 Overstock.com annual report below. You can navigate through the pages in the report by either clicking on the pages listed below, or by using the keyword search tool below to find specific information within the annual report.-
 1
1 -
2
-
3
-
4
-
5
-
6
-
7
-
8
-
9
-
10
-
11
-
12
-
13
-
14
-
15
-
16
-
17
-
18
-
19
-
20
-
21
-
22
-
23
-
24
-
25
-
26
-
27
-
28
-
29
-
30
-
31
-
32
-
33
-
34
-
35
-
36
-
37
-
38
-
39
-
40
-
41
-
42
-
43
-
44
-
45
-
46
-
47
-
48
-
49
-
50
-
51
-
52
-
53
-
54
-
55
-
56
-
57
-
58
-
59
-
60
-
61
-
62
-
63
-
64
-
 65
65 -
 66
66 -
 67
67 -
 68
68 -
 69
69 -
 70
70 -
 71
71 -
 72
72 -
 73
73 -
 74
74 -
 75
75 -
 76
76 -
 77
77 -
 78
78 -
 79
79 -
 80
80 -
 81
81 -
 82
82 -
 83
83 -
 84
84 -
 85
85 -
86
-
87
-
88
-
89
-
90
-
91
-
92
-
93
-
94
-
95
-
96
-
97
-
98
-
99
-
100
-
101
-
102
-
103
-
104
-
105
-
106
-
107
-
108
-
109
-
110
-
111
-
112
-
113
-
114
-
115
-
116
-
117
-
118
-
119
-
120
-
121
-
122
-
123
-
124
-
125
-
126
-
127
-
128
-
129
-
130
-
131
-
132
-
133
-
134
-
135
-
136
-
137
-
138
-
139
-
140
-
141
-
142
-
143
-
144
-
145
-
146
-
147
-
148
-
149
-
150
-
151
-
152
-
153
-
154
-
155
-
156
-
157
-
158
-
159
-
160
-
161
-
162
-
163
-
164
-
165
-
166
-
167
-
168
 |
 |

Table of Contents
convertible senior notes in a transaction exempt from registration under the Securities Act. During 2006, we received $64.4 million from two stock offerings
in May and December.
Current sources of liquidity
While we believe that the cash and cash equivalents currently on hand, amounts available under our credit facility and expected cash flows from future
operations will be sufficient to continue operations for at least the next twelve months, we may require additional financing. However, there can be no
assurance that if additional financing is necessary it will be available, or, if available, that such financing can be obtained on satisfactory terms. Failure to
generate sufficient revenues, profits or to raise additional capital could have a material adverse effect on our ability to continue as a going concern and to
achieve our intended business objectives. Any projections of future cash needs and cash flows are subject to substantial uncertainty.
Our principal sources of liquidity are cash flows generated from operations and our existing cash, cash equivalents, and sale or maturity of marketable
securities. At December 31, 2009, our cash and cash equivalents balance was $139.8 million.
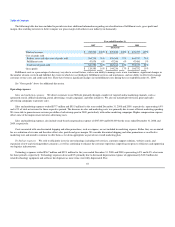
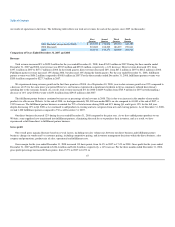
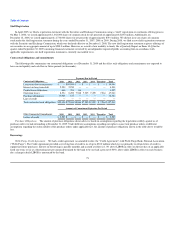
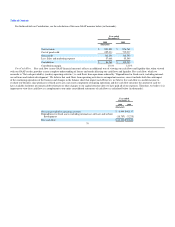
Cash flow information is as follows:
Year ended December 31
2007 2008 2009
(Restated)
(in thousands)
Cash provided by (used in):
Operating activities $ 13,660 $ 6,444 $ 46,117
Investing activities (33,514) 19,533 2,868
Financing activities (2,031) (22,327) (5,685)
Free Cash Flow. "Free Cash Flow" (a non-GAAP measure) for the years ended December 31, 2008 and 2009, was $(12.3) million and $38.8 million.
See "Non-GAAP Financial Measures" below for a reconciliation of Free Cash Flow to net cash provided by operating activities.
Cash provided by (used in) operating activities. For the years ended December 31, 2008 and 2009, our operating activities resulted in net cash inflows
of $6.4 million and $46.1 million, respectively.
Cash received from customers generally corresponds to our net sales as our customers primarily use credit cards to buy from us causing our receivables
from these sales transactions to settle quickly. We have payment terms with our fulfillment partners that generally extend beyond the amount of time
necessary to collect proceeds from our customers. As a result, following our seasonally strong fourth quarter sales, at December 31 of each year, our cash,
cash equivalents, marketable securities and accounts payable balances typically reach their highest level (other than as a result of cash flows provided by or
used in investing and financing activities). However, our accounts payable balance normally declines during the first three months following year-end, which
normally results in a decline in our cash, cash equivalents, and marketable securities balances from the year-end balance. The seasonality of our business
causes payables and accruals to grow significantly in the fourth quarter, and then decrease in the first quarter when they are paid.
The $46.1 million of net cash provided by operating activities during the year ended December 31, 2009 was primarily due to positive net income of
$7.7 million for the year ended December 31, 2009. Net cash was also provided by increases in accounts payable of $18.6 million due to increased unpaid
purchases of inventory related to both increased fulfillment partner sales at the end of the fourth quarter and increased purchases of inventory made at the end
of the fourth quarter to meet holiday sales demand and other demand. A $9.1 million increase in accrued liabilities also contributed to this increase in cash
provided by operating activities and related to an increased payroll and bonus accrual.
72