Overstock.com 2009 Annual Report Download - page 100
Download and view the complete annual report
Please find page 100 of the 2009 Overstock.com annual report below. You can navigate through the pages in the report by either clicking on the pages listed below, or by using the keyword search tool below to find specific information within the annual report.-
 1
1 -
2
-
3
-
4
-
5
-
6
-
7
-
8
-
9
-
10
-
11
-
12
-
13
-
14
-
15
-
16
-
17
-
18
-
19
-
20
-
21
-
22
-
23
-
24
-
25
-
26
-
27
-
28
-
29
-
30
-
31
-
32
-
33
-
34
-
35
-
36
-
37
-
38
-
39
-
40
-
41
-
42
-
43
-
44
-
45
-
46
-
47
-
48
-
49
-
50
-
51
-
52
-
53
-
54
-
55
-
56
-
57
-
58
-
59
-
60
-
61
-
62
-
63
-
64
-
65
-
66
-
67
-
68
-
69
-
70
-
71
-
72
-
73
-
74
-
75
-
76
-
77
-
78
-
79
-
80
-
81
-
82
-
83
-
84
-
85
-
86
-
87
-
88
-
89
-
 90
90 -
 91
91 -
 92
92 -
 93
93 -
 94
94 -
 95
95 -
 96
96 -
 97
97 -
 98
98 -
 99
99 -
 100
100 -
 101
101 -
 102
102 -
 103
103 -
 104
104 -
 105
105 -
 106
106 -
 107
107 -
 108
108 -
 109
109 -
 110
110 -
111
-
112
-
113
-
114
-
115
-
116
-
117
-
118
-
119
-
120
-
121
-
122
-
123
-
124
-
125
-
126
-
127
-
128
-
129
-
130
-
131
-
132
-
133
-
134
-
135
-
136
-
137
-
138
-
139
-
140
-
141
-
142
-
143
-
144
-
145
-
146
-
147
-
148
-
149
-
150
-
151
-
152
-
153
-
154
-
155
-
156
-
157
-
158
-
159
-
160
-
161
-
162
-
163
-
164
-
165
-
166
-
167
-
168
 |
 |

Table of Contents
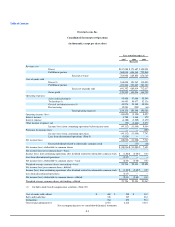
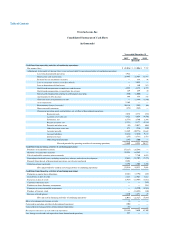
Overstock.com, Inc.
Consolidated Statements of Cash Flows
(in thousands)
Year ended December 31
2007 2008 2009
(Restated)
Cash flows from operating activities of continuing operations:
Net income (loss) $ (48,036) $ (11,006)$ 7,747
Adjustments to reconcile net income (loss) to net cash provided by operating activities of continuing operations:
Loss from discontinued operations 3,924 — —
Depreciation and amortization 29,495 22,968 12,883
Realized loss on marketable securities — 334 48
Loss on settlement of notes receivable (Note 5) — 3,929 —
Loss on disposition of fixed assets 1 140 183
Stock-based compensation to employees and directors 4,522 4,372 4,775
Stock-based compensation to consultants for services 189 259 10
Stock-based compensation relating to performance share plan (550) (1,000) —
Amortization of debt discount 344 334 331
Gain from early extinguishment of debt — (2,849) (2,810)
Asset impairment 2,169 — —
Restructuring charges (reversals) 10,114 (299) (66)
Notes receivable accretion (272) (545) —
Changes in operating assets and liabilities, net of effect of discontinued operations:
Restricted cash 3,636 4,372 (152)
Accounts receivable, net 4,822 4,654 (4,540)
Inventories, net (1,773) 3,790 1,344
Prepaid inventory, net (1,331) 2,177 (2,118)
Prepaids and other assets (52) (2,027) (604)
Other long-term assets, net 471 (516) (120)
Accounts payable 11,849 (10,774) 18,642
Accrued liabilities (5,414) (7,636) 9,131
Deferred revenue (255) (3,733) 1,433
Other long-term liabilities (193) (500) —
Net cash provided by operating activities of continuing operations 13,660 6,444 46,117
Cash flows from investing activities of continuing operations:
Purchases of marketable securities (75,217) (35,548) —
Maturities of marketable securities 29,258 64,542 —
Sale of marketable securities prior to maturity — 7,740 8,893
Expenditures for fixed assets, including internal-use software and website development (2,643) (18,707) (7,275)
Proceeds from the sale of discontinued operations, net of cash transferred 9,892 — —
Collection of note receivable 5,196 1,506 1,250
Net cash provided by (used in) investing activities of continuing operations (33,514) 19,533 2,868
Cash flows from financing activities of continuing operations:
Payments on capital lease obligations (5,261) (3,796) (348)
Drawdowns on line of credit 2,423 12,963 1,612
Payments on line of credit (2,423) (12,963) (1,612)
Capitalized financing costs — — (245)
Paydown on direct financing arrangement — — (218)
Payments to retire convertible senior notes — (6,550) (4,563)
Purchase of treasury stock — (13,452) (340)
Exercise of stock options 3,230 1,471 29
Net cash used in financing activities of continuing operations (2,031) (22,327) (5,685)
Effect of exchange rate changes on cash (3) — —
Cash used in operating activities of discontinued operations (204) — —
Cash used in investing activities of discontinued operations (53) — —
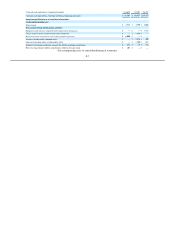
Net increase (decrease) in cash and cash equivalents (22,145) 3,650 43,300
Less change in cash and cash equivalents from discontinued operations 257 — —