Overstock.com 2009 Annual Report Download - page 53
Download and view the complete annual report
Please find page 53 of the 2009 Overstock.com annual report below. You can navigate through the pages in the report by either clicking on the pages listed below, or by using the keyword search tool below to find specific information within the annual report.-
 1
1 -
2
-
3
-
4
-
5
-
6
-
7
-
8
-
9
-
10
-
11
-
12
-
13
-
14
-
15
-
16
-
17
-
18
-
19
-
20
-
21
-
22
-
23
-
24
-
25
-
26
-
27
-
28
-
29
-
30
-
31
-
32
-
33
-
34
-
35
-
36
-
37
-
38
-
39
-
40
-
41
-
42
-
 43
43 -
 44
44 -
 45
45 -
 46
46 -
 47
47 -
 48
48 -
 49
49 -
 50
50 -
 51
51 -
 52
52 -
 53
53 -
 54
54 -
 55
55 -
 56
56 -
 57
57 -
 58
58 -
 59
59 -
 60
60 -
 61
61 -
 62
62 -
 63
63 -
64
-
65
-
66
-
67
-
68
-
69
-
70
-
71
-
72
-
73
-
74
-
75
-
76
-
77
-
78
-
79
-
80
-
81
-
82
-
83
-
84
-
85
-
86
-
87
-
88
-
89
-
90
-
91
-
92
-
93
-
94
-
95
-
96
-
97
-
98
-
99
-
100
-
101
-
102
-
103
-
104
-
105
-
106
-
107
-
108
-
109
-
110
-
111
-
112
-
113
-
114
-
115
-
116
-
117
-
118
-
119
-
120
-
121
-
122
-
123
-
124
-
125
-
126
-
127
-
128
-
129
-
130
-
131
-
132
-
133
-
134
-
135
-
136
-
137
-
138
-
139
-
140
-
141
-
142
-
143
-
144
-
145
-
146
-
147
-
148
-
149
-
150
-
151
-
152
-
153
-
154
-
155
-
156
-
157
-
158
-
159
-
160
-
161
-
162
-
163
-
164
-
165
-
166
-
167
-
168
 |
 |
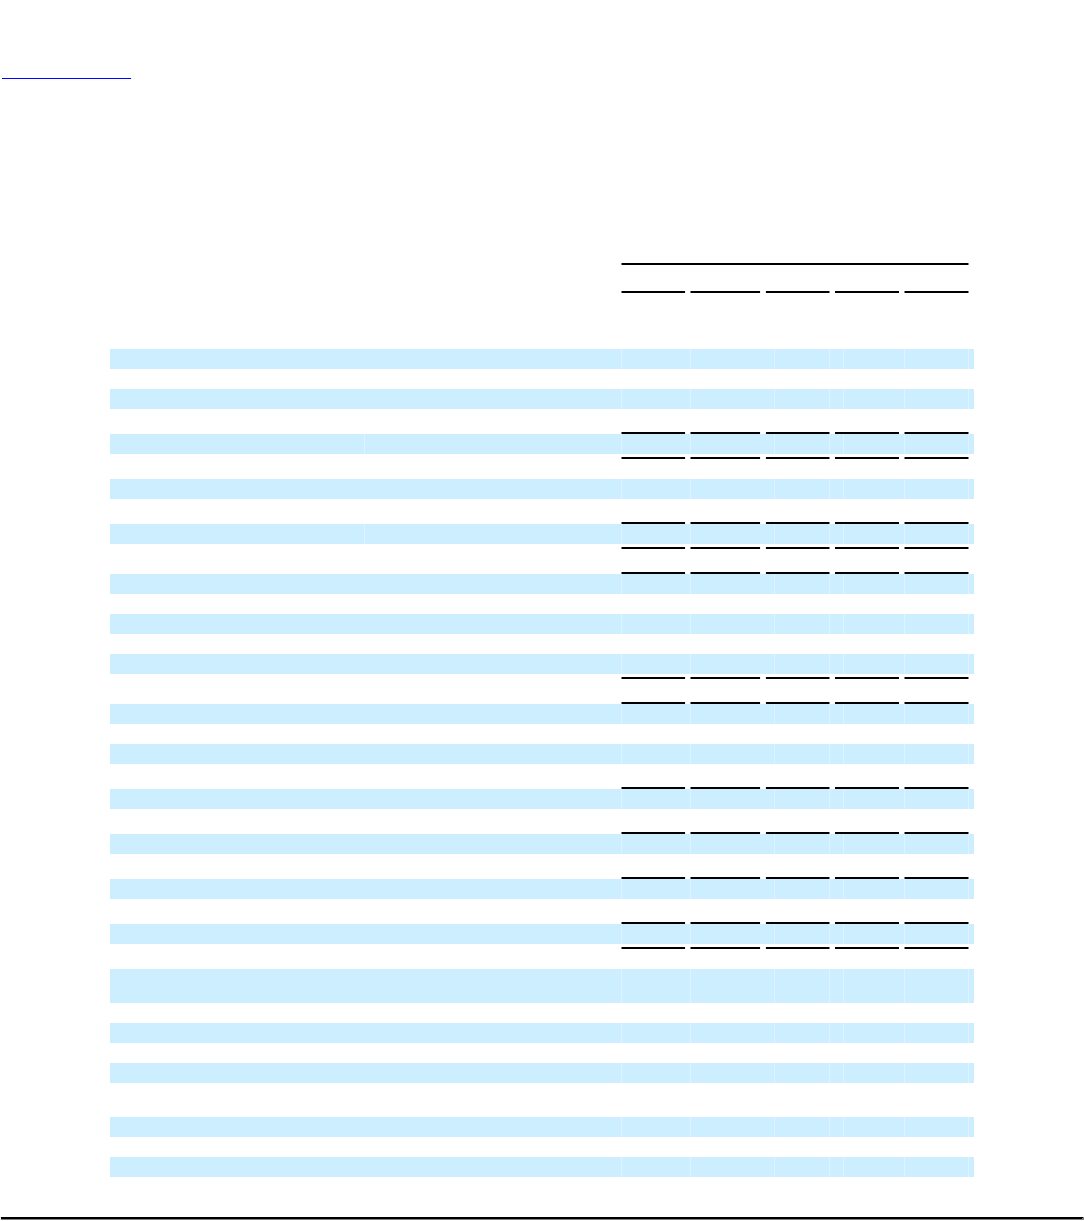
Table of Contents
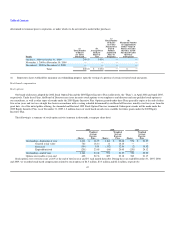
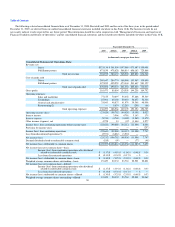
The following selected consolidated financial data as of December 31, 2008 (Restated) and 2009 and for each of the three years in the period ended
December 31, 2009, are derived from our audited consolidated financial statements included elsewhere in this Form 10-K. The historical results do not
necessarily indicate results expected for any future period. This information should be read in conjunction with "Management's Discussion and Analysis of
Financial Condition and Results of Operations" and the consolidated financial statements and the related notes thereto included elsewhere in this Form 10-K.
Year ended December 31,
2005 2006(1) 2007 2008(4) 2009
(Restated)
(in thousands, except per share data)
Consolidated Statement of Operations Data:
Revenue, net
Direct $323,136 $ 301,509 $197,088 $173,687 $150,901
Fulfillment partner 471,839 478,628 568,814 656,163 725,868
Total net revenue 794,975 780,137 765,902 829,850 876,769
Cost of goods sold
Direct 280,647 284,774 168,008 153,967 130,890
Fulfillment partner 397,855 405,559 473,344 531,647 581,127
Total cost of goods sold 678,502 690,333 641,352 685,614 712,017
Gross profit 116,473 89,804 124,550 144,236 164,752
Operating expenses:
Sales and marketing 77,155 70,897 55,458 57,668 55,549
Technology 27,901 65,158 59,453 56,677 52,336
General and administrative 33,043 46,837 41,976 39,348 48,906
Restructuring(2) — 5,674 12,283 (299) (66)
Total operating expenses 138,099 188,566 169,170 153,394 156,725
Operating income (loss) (21,626) (98,762) (44,620) (9,158) 8,027
Interest income — 3,566 4,788 3,163 170
Interest expense (5,743) (4,765) (4,188) (3,565) (3,470)
Other income (expense), net 4,728 81 (92) (1,446) 3,277
Income (loss) from continuing operations before income taxes (22,641) (99,880) (44,112) (11,006) 8,004
Provision for income taxes — — — — (257)
Income (loss) from continuing operations (22,641) (99,880) (44,112) (11,006) 7,747
Loss from discontinued operations(3) (2,571) (6,882) (3,924) — —
Net income (loss) (25,212) (106,762) (48,036) (11,006) 7,747
Deemed dividend related to redeemable common stock (185) (99) — (77) (48)
Net income (loss) attributable to common shares $ (25,397)$(106,861)$ (48,036)$ (11,083)$ 7,699
Net income (loss) per common share—basic:
Income (loss) from continuing operations after dividend
related to redeemable common stock $ (1.17)$ (4.91)$ (1.86)$ (0.48)$ 0.34
Loss from discontinued operations $ (0.13)$ (0.34)$ (0.17)$ — $ —
Net income (loss) attributable to common share—basic $ (1.30)$ (5.25)$ (2.03)$ (0.48)$ 0.34
Weighted average common shares outstanding—basic 19,429 20,332 23,704 22,901 22,821
Net income (loss) per common share—diluted:
Income (loss) from continuing operations after dividend
related to redeemable common stock $ (1.17)$ (4.91)$ (1.86)$ (0.48)$ 0.33
Loss from discontinued operations $ (0.13)$ (0.34)$ (0.17)$ — $ —
Net income (loss) attributable to common shares—diluted $ (1.30)$ (5.25)$ (2.03)$ (0.48)$ 0.33
Weighted average common shares outstanding—diluted 19,429 20,332 23,704 22,901 23,067
50