Overstock.com 2009 Annual Report Download - page 149
Download and view the complete annual report
Please find page 149 of the 2009 Overstock.com annual report below. You can navigate through the pages in the report by either clicking on the pages listed below, or by using the keyword search tool below to find specific information within the annual report.-
 1
1 -
2
-
3
-
4
-
5
-
6
-
7
-
8
-
9
-
10
-
11
-
12
-
13
-
14
-
15
-
16
-
17
-
18
-
19
-
20
-
21
-
22
-
23
-
24
-
25
-
26
-
27
-
28
-
29
-
30
-
31
-
32
-
33
-
34
-
35
-
36
-
37
-
38
-
39
-
40
-
41
-
42
-
43
-
44
-
45
-
46
-
47
-
48
-
49
-
50
-
51
-
52
-
53
-
54
-
55
-
56
-
57
-
58
-
59
-
60
-
61
-
62
-
63
-
64
-
65
-
66
-
67
-
68
-
69
-
70
-
71
-
72
-
73
-
74
-
75
-
76
-
77
-
78
-
79
-
80
-
81
-
82
-
83
-
84
-
85
-
86
-
87
-
88
-
89
-
90
-
91
-
92
-
93
-
94
-
95
-
96
-
97
-
98
-
99
-
100
-
101
-
102
-
103
-
104
-
105
-
106
-
107
-
108
-
109
-
110
-
111
-
112
-
113
-
114
-
115
-
116
-
117
-
118
-
119
-
120
-
121
-
122
-
123
-
124
-
125
-
126
-
127
-
128
-
129
-
130
-
131
-
132
-
133
-
134
-
135
-
136
-
137
-
138
-
 139
139 -
 140
140 -
 141
141 -
 142
142 -
 143
143 -
 144
144 -
 145
145 -
 146
146 -
 147
147 -
 148
148 -
 149
149 -
 150
150 -
 151
151 -
 152
152 -
 153
153 -
 154
154 -
 155
155 -
 156
156 -
 157
157 -
 158
158 -
 159
159 -
160
-
161
-
162
-
163
-
164
-
165
-
166
-
167
-
168
 |
 |

Table of Contents
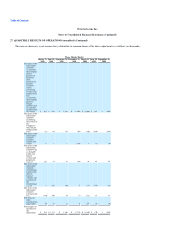
Overstock.com, Inc.
Notes to Consolidated Financial Statements (Continued)
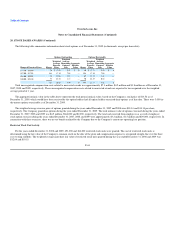
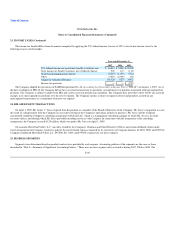
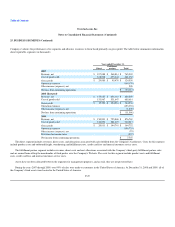
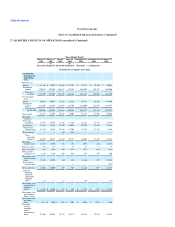
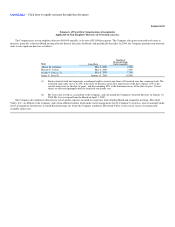
27. QUARTERLY RESULTS OF OPERATIONS (unaudited) (Continued)
The following tables set forth the Company's unaudited quarterly results of operations data for the eight most recent quarters for the period ended
December 31, 2009. The Company has prepared this information on the same basis as the consolidated statements of operations and the information includes
all adjustments that it considers necessary for a fair statement of its financial position and operating results for the quarters presented.
Three Months Ended
March 31,
2008 March 31,
2008 June 30,
2008 June 30,
2008 September 30,
2008 September 30,
2008 December 31,
2008 December 31,
2008
(Restated)
(As
Reported)
(Restated)
(As
Reported)
(Restated)
(As Reported)
(Restated)
(As
Reported)
(in thousands, except per share data)
Consolidated
Statement of
Operations
Data:
Revenue, net
Direct $ 51,655 $ 51,764 $ 39,713 $ 39,832 $ 34,079 $ 34,176 $ 48,240 $ 48,431
Fulfillment
partner 150,145 151,050 148,489 149,004 151,928 152,679 205,601 207,431
Total net
revenue 201,800 202,814 188,202 188,836 186,007 186,855 253,841 255,862
Cost of goods
sold
Direct 44,697 44,803 34,756 34,871 30,541 30,633 43,973 44,194
Fulfillment
partner 122,491 124,040 119,212 120,756 122,053 124,103 167,891 168,058
Total cost of
goods sold 167,188 168,843 153,968 155,627 152,594 154,736 211,864 212,252
Gross profit 34,612 33,971 34,234 33,209 33,413 32,119 41,977 43,610
Operating
expenses:
Sales and
marketing 15,023 15,019 14,254 14,244 11,944 11,934 16,447 16,437
Technology 14,489 14,516 15,049 15,311 13,784 14,119 13,355 13,869
General and
administrative 9,392 9,563 11,068 10,867 10,691 10,321 8,197 7,622
Restructuring — — (299) — — — — —
Total
operating
expenses 38,904 39,098 40,072 40,422 36,419 36,374 37,999 37,928
Operating
income (loss) (4,292) (5,127) (5,838) (7,213) (3,006) (4,255) 3,978 5,682
Interest income 1,304 1,304 740 740 664 664 455 455
Interest expense (901) (901) (936) (888) (907) (847) (821) (826)
Other income
(expense), net — — 2 2 2,849 2,849 (4,297) (4,297)
Net income (loss)
before income
taxes (3,889) (4,724) (6,032) (7,359) (400) (1,589) (685) $ 1,014
Provision for
income taxes — — — — — — — —
Net income (loss) (3,889) (4,724) (6,032) (7,359) (400) (1,589) (685) 1,014
Deemed dividend
related to
redeemable
common stock (21) — (16) — (20) — (20) —
Net income (loss)
attributable to
common
shares $ (3,910) $ (4,724) $ (6,048) $ (7,359) $ (420) $ (1,589) $ (705) $ 1,014
Net income (loss)
per common
share—basic:
Net income (loss)
per share—
basic $ (0.17) $ (0.20) $ (0.27) $ (0.32) $ (0.02) $ (0.07) $ (0.03) $ 0.04
Weighted
average
common
shares
outstanding—
basic 23,345 23,345 22,750 22,750 22,768 22,768 22,745 22,745