Overstock.com 2009 Annual Report Download - page 65
Download and view the complete annual report
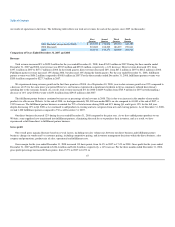
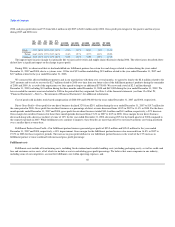
Please find page 65 of the 2009 Overstock.com annual report below. You can navigate through the pages in the report by either clicking on the pages listed below, or by using the keyword search tool below to find specific information within the annual report.-
 1
1 -
2
-
3
-
4
-
5
-
6
-
7
-
8
-
9
-
10
-
11
-
12
-
13
-
14
-
15
-
16
-
17
-
18
-
19
-
20
-
21
-
22
-
23
-
24
-
25
-
26
-
27
-
28
-
29
-
30
-
31
-
32
-
33
-
34
-
35
-
36
-
37
-
38
-
39
-
40
-
41
-
42
-
43
-
44
-
45
-
46
-
47
-
48
-
49
-
50
-
51
-
52
-
53
-
54
-
 55
55 -
 56
56 -
 57
57 -
 58
58 -
 59
59 -
 60
60 -
 61
61 -
 62
62 -
 63
63 -
 64
64 -
 65
65 -
 66
66 -
 67
67 -
 68
68 -
 69
69 -
 70
70 -
 71
71 -
 72
72 -
 73
73 -
 74
74 -
 75
75 -
76
-
77
-
78
-
79
-
80
-
81
-
82
-
83
-
84
-
85
-
86
-
87
-
88
-
89
-
90
-
91
-
92
-
93
-
94
-
95
-
96
-
97
-
98
-
99
-
100
-
101
-
102
-
103
-
104
-
105
-
106
-
107
-
108
-
109
-
110
-
111
-
112
-
113
-
114
-
115
-
116
-
117
-
118
-
119
-
120
-
121
-
122
-
123
-
124
-
125
-
126
-
127
-
128
-
129
-
130
-
131
-
132
-
133
-
134
-
135
-
136
-
137
-
138
-
139
-
140
-
141
-
142
-
143
-
144
-
145
-
146
-
147
-
148
-
149
-
150
-
151
-
152
-
153
-
154
-
155
-
156
-
157
-
158
-
159
-
160
-
161
-
162
-
163
-
164
-
165
-
166
-
167
-
168
 |
 |

Table of Contents
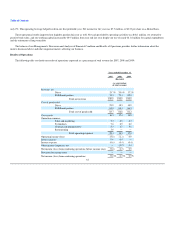
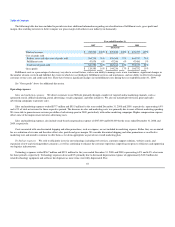
Comparison of Years Ended December 31, 2008 and 2009
Revenue
Total net revenue increased 6% from $829.9 million for the year ended December 31, 2008, to $876.8 million for the year ended December 31, 2009.
Direct revenue decreased 13% from $173.7 million in 2008 to $150.9 million in 2009, and fulfillment partner revenue increased 11% from
$656.2 million to $725.9 million.
Total net revenue increased 27% from $253.8 million for the three month period ended December 31, 2008 to $322.4 million for the three month period
ended December 31, 2009. Direct revenue increased 14% from $48.2 million to $55.1 million. Fulfillment partner revenue increased 30% from $205.6 million
to $267.3 million for the three month period ended December 31, 2009.
Total revenues from Auctions, Cars and Real Estate businesses were $1.0 million and $2.1 million for the years ended December 31, 2008 and 2009,
respectively. Total revenues from International sales were $1.3 million and $5.1 million for the years ended December 31, 2008 and 2009, respectively.
See "Executive Commentary" above for additional discussion regarding revenue and revenue growth.
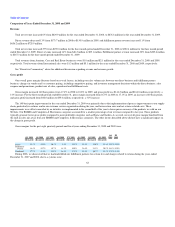
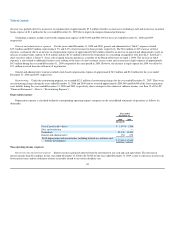
Gross profit
Our overall gross margins fluctuate based on several factors, including our sales volume mix between our direct business and fulfillment partner
business; changes in vendor and / or customer pricing, including competitive pricing, and inventory management decisions within the direct business; sales
coupons and promotions; product mix of sales; operational and fulfillment costs.
Gross margin increased 140 basis points, from 17.4% in 2008 to 18.8% in 2009, and gross profit was $144.2 million and $164.8 million, respectively, a
14% increase. For the three month periods ended December 31, gross margin increased from 16.5% in 2008 to 17.1% in 2009, an increase of 60 basis points,
and gross profit increased from $42.0 million to $55.0 million, respectively, a 31% increase.
The 140 basis point improvement for the year ended December 31, 2009 was primarily due to the implementation of process improvements to our supply
chain, particularly in returns, and in our customer service organization during the year, and lower return rates and net returns-related costs. These
improvements were offset somewhat by an initiative we implemented in the second half of the year to lower prices on many of the products we sold on our
Website. Our BMMG and Computers & Electronics categories accounted for a smaller percentage of our revenues compared to last year. These products
typically generate lower gross profits compared to more profitable categories such as Home and Garden. As a result, our overall gross margin benefited from
the shift in sales mix away from our BMMG and Computers & Electronics categories. The other factors described above did not have a significant impact on
the change in gross profit.
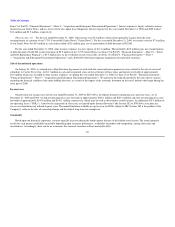
Gross margins for the past eight quarterly periods and fiscal years ending December 31, 2008 and 2009 were:
Q1 2008 Q2 2008 Q3 2008 Q4 2008 FY 2008 Q1 2009 Q2 2009 Q3 2009 Q4
2009 FY
2009
(Restated)
(Restated)
(Restated)
(Restated)
(Restated)
(Restated)
(Restated)
(Restated)
Direct 13.5% 12.5% 10.4% 8.8% 11.4% 12.9% 18.0% 11.8% 11.9% 13.3%
Fulfillment
Partner 18.4% 19.7% 19.7% 18.3% 19.0% 21.0% 21.3% 20.7% 18.1% 19.9%
Combined 17.2% 18.2% 18.0% 16.5% 17.4% 19.5% 20.7% 19.3% 17.1% 18.8%
During 2008, we discovered that we had underbilled our fulfillment partners for certain fees and charges related to returns during the years ended
December 31, 2007 and 2008, due to a systems issue.
62