Overstock.com 2009 Annual Report Download - page 151
Download and view the complete annual report
Please find page 151 of the 2009 Overstock.com annual report below. You can navigate through the pages in the report by either clicking on the pages listed below, or by using the keyword search tool below to find specific information within the annual report.-
 1
1 -
2
-
3
-
4
-
5
-
6
-
7
-
8
-
9
-
10
-
11
-
12
-
13
-
14
-
15
-
16
-
17
-
18
-
19
-
20
-
21
-
22
-
23
-
24
-
25
-
26
-
27
-
28
-
29
-
30
-
31
-
32
-
33
-
34
-
35
-
36
-
37
-
38
-
39
-
40
-
41
-
42
-
43
-
44
-
45
-
46
-
47
-
48
-
49
-
50
-
51
-
52
-
53
-
54
-
55
-
56
-
57
-
58
-
59
-
60
-
61
-
62
-
63
-
64
-
65
-
66
-
67
-
68
-
69
-
70
-
71
-
72
-
73
-
74
-
75
-
76
-
77
-
78
-
79
-
80
-
81
-
82
-
83
-
84
-
85
-
86
-
87
-
88
-
89
-
90
-
91
-
92
-
93
-
94
-
95
-
96
-
97
-
98
-
99
-
100
-
101
-
102
-
103
-
104
-
105
-
106
-
107
-
108
-
109
-
110
-
111
-
112
-
113
-
114
-
115
-
116
-
117
-
118
-
119
-
120
-
121
-
122
-
123
-
124
-
125
-
126
-
127
-
128
-
129
-
130
-
131
-
132
-
133
-
134
-
135
-
136
-
137
-
138
-
139
-
140
-
 141
141 -
 142
142 -
 143
143 -
 144
144 -
 145
145 -
 146
146 -
 147
147 -
 148
148 -
 149
149 -
 150
150 -
 151
151 -
 152
152 -
 153
153 -
 154
154 -
 155
155 -
 156
156 -
 157
157 -
 158
158 -
 159
159 -
 160
160 -
 161
161 -
162
-
163
-
164
-
165
-
166
-
167
-
168
 |
 |

Table of Contents
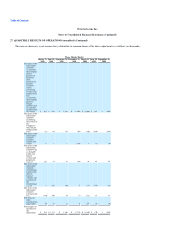
Overstock.com, Inc.
Notes to Consolidated Financial Statements (Continued)
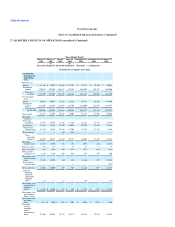
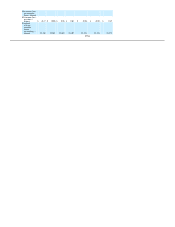
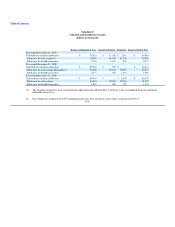
27. QUARTERLY RESULTS OF OPERATIONS (unaudited) (Continued)
Three Months Ended
March 31,
2009 March 31,
2009 June 30,
2009 June 30,
2009 September 30,
2009 September 30,
2009 December 31,
2009
(Restated)
(As
Reported)
(Restated)
(As
Reported)
(Restated)
(As Reported)
(in thousands, except per share data)
Consolidated
Statement of
Operations
Data:
Revenue, net
Direct $ 34,882 $ 35,059 $ 28,685 $ 28,788 $ 32,281 $ 32,369 $ 55,053
Fulfillment
partner 150,847 152,308 146,213 147,355 161,502 162,712 267,306
Total net
revenue 185,729 187,367 174,898 176,143 193,783 195,081 322,359
Cost of goods
sold
Direct 30,397 30,478 23,532 23,726 28,471 28,453 48,490
Fulfillment
partner 119,201 119,198 115,079 116,509 128,000 128,959 218,847
Total cost of
goods sold 149,598 149,676 138,611 140,235 156,471 157,412 267,337
Gross profit 36,131 37,691 36,287 35,908 37,312 37,669 55,022
Operating
expenses:
Sales and
marketing 13,587 13,540 11,162 11,122 12,222 12,187 18,578
Technology 13,591 13,789 12,708 12,649 12,499 12,445 13,538
General and
administrative 13,834 13,454 12,326 12,204 13,288 13,191 9,458
Restructuring — — (66) (218) — — —
Total
operating
expenses 41,012 40,783 36,130 35,757 38,009 37,823 41,574
Operating
income (loss) (4,881) (3,092) 157 151 (697) (154) 13,448
Interest income 123 123 27 27 11 11 9
Interest expense (922) (866) (808) (743) (977) (941) (763)
Other income
(expense), net 1,736 1,736 954 954 297 297 290
Net income (loss)
before income
taxes (3,944) (2,099) 330 389 (1,366) (787) 12,984
Provision for
income taxes — — — — — — (257)
Net income (loss) (3,944) (2,099) 330 389 (1,366) (787) 12,727
Deemed
dividend
related to
redeemable
common
stock (11) — (11) — (13) — (13)
Net income (loss)
attributable to
common
shares $ (3,955) $ (2,099) $ 319 $ 389 $ (1,379) $ (787) $ 12,714
Net income (loss)
per common
share—basic:
Net income (loss)
per share—
basic $ (0.17) $ (0.09) $ 0.01 $ 0.02 $ (0.06) $ (0.03) $ 0.56
Weighted
average
common
shares
outstanding—
basic 22,803 22,803 22,817 22,817 22,824 22,824 22,838