Overstock.com 2009 Annual Report Download - page 140
Download and view the complete annual report
Please find page 140 of the 2009 Overstock.com annual report below. You can navigate through the pages in the report by either clicking on the pages listed below, or by using the keyword search tool below to find specific information within the annual report.-
 1
1 -
2
-
3
-
4
-
5
-
6
-
7
-
8
-
9
-
10
-
11
-
12
-
13
-
14
-
15
-
16
-
17
-
18
-
19
-
20
-
21
-
22
-
23
-
24
-
25
-
26
-
27
-
28
-
29
-
30
-
31
-
32
-
33
-
34
-
35
-
36
-
37
-
38
-
39
-
40
-
41
-
42
-
43
-
44
-
45
-
46
-
47
-
48
-
49
-
50
-
51
-
52
-
53
-
54
-
55
-
56
-
57
-
58
-
59
-
60
-
61
-
62
-
63
-
64
-
65
-
66
-
67
-
68
-
69
-
70
-
71
-
72
-
73
-
74
-
75
-
76
-
77
-
78
-
79
-
80
-
81
-
82
-
83
-
84
-
85
-
86
-
87
-
88
-
89
-
90
-
91
-
92
-
93
-
94
-
95
-
96
-
97
-
98
-
99
-
100
-
101
-
102
-
103
-
104
-
105
-
106
-
107
-
108
-
109
-
110
-
111
-
112
-
113
-
114
-
115
-
116
-
117
-
118
-
119
-
120
-
121
-
122
-
123
-
124
-
125
-
126
-
127
-
128
-
129
-
 130
130 -
 131
131 -
 132
132 -
 133
133 -
 134
134 -
 135
135 -
 136
136 -
 137
137 -
 138
138 -
 139
139 -
 140
140 -
 141
141 -
 142
142 -
 143
143 -
 144
144 -
 145
145 -
 146
146 -
 147
147 -
 148
148 -
 149
149 -
 150
150 -
151
-
152
-
153
-
154
-
155
-
156
-
157
-
158
-
159
-
160
-
161
-
162
-
163
-
164
-
165
-
166
-
167
-
168
 |
 |

Table of Contents
Overstock.com, Inc.
Notes to Consolidated Financial Statements (Continued)
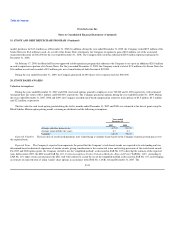
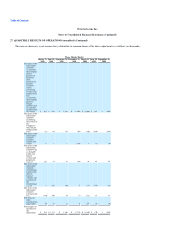
20. STOCK BASED AWARDS (Continued)
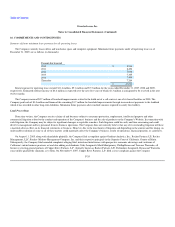
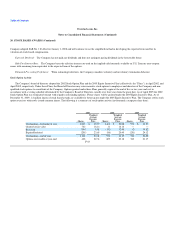
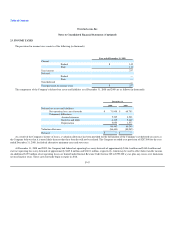
The following is a summary of restricted stock unit activity (amounts in thousands, except per share data):
2008 2009
Units
Weighted Average
Grant Date
Fair Value Units
Weighted Average
Grant Date
Fair Value
Outstanding—beginning of year — $ — 449 $ 12.69
Granted at fair value 491 12.64 366 10.15
Vested — — (110) 12.64
Forfeited (42) 12.13 (65) 11.55
Outstanding—end of year 449 12.69 640 11.35
The restricted stock units vest over three years at 25% at the end of the first year, 25% at the end of the second year and 50% at the end of the third year.
During the years ended December 31, 2007, 2008 and 2009, the Company recorded stock based compensation related to restricted stock units of $0,
$1.4 million and $2.6 million, respectively. Changes to the forfeiture rate are accounted for as a cumulative effect of change in the period of such change. In
the fourth quarter of 2009, the Company performed its periodic review of its estimated forfeiture rate and based on lower actual turnover than expected during
the previous twelve months, the Company adjusted its forfeiture rate from 25% to 21%. This change in estimated forfeiture rate resulted in a $220,000
increase in share-based compensation expense in the fourth quarter of 2009.
At December 31, 2009, there were 640,000 restricted stock units that remained outstanding. On February 1, 2010, the Company granted 250,000
additional restricted stock units.
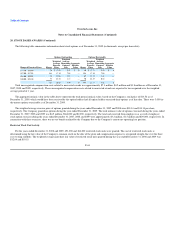
Performance Share Plan
In January 2006, the Board of Directors and Compensation Committee adopted the Overstock.com Performance Share Plan (the "Plan") and approved
grants to executive officers and certain employees of the Company. The Plan provided for a three-year period for the measurement of the Company's
attainment of the performance goal described in the form of grant.
The performance goal was measured by growth in economic value, as defined in the Plan. The amount of payments due to participants under the Plan
was a function of the then current market price of a share of the Company's common stock, multiplied by a percentage dependent on the extent to which the
performance goal was attained, which was between 0% and 200%. If the growth in economic value was 10% compounded annually or less, the percentage
would be 0%. If the growth in economic value was 25% compounded annually, the percentage would be 100%. If the growth in economic value was 40%
compounded annually or more, the percentage would be 200%. If the percentage growth was between these percentages, the payment percentage would be
determined on the basis of straight line interpolation. Amounts payable under the Plan were subject to Board discretion. Amounts payable under the Plan were
originally payable in cash. The Company recorded compensation expense based upon the period-end stock price (prior to the third quarter of 2007) and
estimates regarding the ultimate growth in economic value that was expected to occur. These estimates included assumed future growth rates in revenues,
gross margins and other factors.
F-45