Overstock.com 2009 Annual Report Download - page 70
Download and view the complete annual report
Please find page 70 of the 2009 Overstock.com annual report below. You can navigate through the pages in the report by either clicking on the pages listed below, or by using the keyword search tool below to find specific information within the annual report.-
 1
1 -
2
-
3
-
4
-
5
-
6
-
7
-
8
-
9
-
10
-
11
-
12
-
13
-
14
-
15
-
16
-
17
-
18
-
19
-
20
-
21
-
22
-
23
-
24
-
25
-
26
-
27
-
28
-
29
-
30
-
31
-
32
-
33
-
34
-
35
-
36
-
37
-
38
-
39
-
40
-
41
-
42
-
43
-
44
-
45
-
46
-
47
-
48
-
49
-
50
-
51
-
52
-
53
-
54
-
55
-
56
-
57
-
58
-
59
-
 60
60 -
 61
61 -
 62
62 -
 63
63 -
 64
64 -
 65
65 -
 66
66 -
 67
67 -
 68
68 -
 69
69 -
 70
70 -
 71
71 -
 72
72 -
 73
73 -
 74
74 -
 75
75 -
 76
76 -
 77
77 -
 78
78 -
 79
79 -
 80
80 -
81
-
82
-
83
-
84
-
85
-
86
-
87
-
88
-
89
-
90
-
91
-
92
-
93
-
94
-
95
-
96
-
97
-
98
-
99
-
100
-
101
-
102
-
103
-
104
-
105
-
106
-
107
-
108
-
109
-
110
-
111
-
112
-
113
-
114
-
115
-
116
-
117
-
118
-
119
-
120
-
121
-
122
-
123
-
124
-
125
-
126
-
127
-
128
-
129
-
130
-
131
-
132
-
133
-
134
-
135
-
136
-
137
-
138
-
139
-
140
-
141
-
142
-
143
-
144
-
145
-
146
-
147
-
148
-
149
-
150
-
151
-
152
-
153
-
154
-
155
-
156
-
157
-
158
-
159
-
160
-
161
-
162
-
163
-
164
-
165
-
166
-
167
-
168
 |
 |

Table of Contents
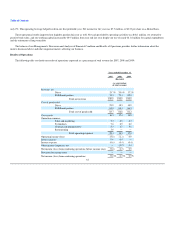
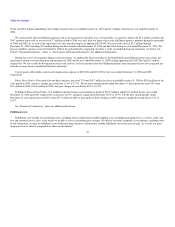
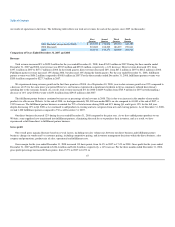
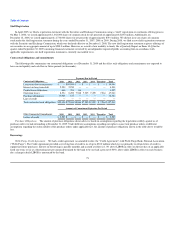
our results of operations in the future. The following table reflects our total net revenues for each of the quarters since 2007 (in thousands):
First
Quarter Second
Quarter Third
Quarter Fourth
Quarter
2009 (Restated, except for Q4 2009) $ 185,729 $ 174,898 193,783 322,359
2008 (Restated) 201,800 188,202 186,007 253,841
2007 162,156 149,171 160,059 294,516
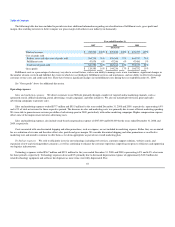
Comparison of Years Ended December 31, 2007 and 2008
Revenue
Total revenue increased 8% to $829.9 million for the year ended December 31, 2008, from $765.9 million in 2007. During the three months ended
December 31, 2007 and 2008, total revenue was $294.5 million and $253.8 million, respectively, a 14% decrease. Direct revenue decreased 12% from
$197.1 million in 2007 to $173.7 million in 2008. In the fourth quarter, direct revenue decreased 28%, from $67.2 million in 2007 to $48.2 million in 2008.
Fulfillment partner revenue increased 15% during 2008, but decreased 10% during the fourth quarter. For the year ended December 31, 2008, fulfillment
partner revenue was $656.2 million compared to $568.8 million in 2007. For the three months ended December 31, 2008, fulfillment partner revenue was
$205.6 million compared to $227.3 million in 2007.
We experienced strong revenue growth in the first three quarters of 2008. As of September 30, 2008, year-to-date revenue growth was 22% compared to
a decrease of 6% for the same prior year period. However, our business experienced a significant slowdown in Q4 as consumers reduced discretionary
spending due to the economic turmoil. As a result, total revenue increased 8% for 2008 to $829.9 million from $765.9 million for 2007 notwithstanding a
decrease of 14% in Q4 2008 revenue to $253.8 million from $294.5 million in Q4 2007.
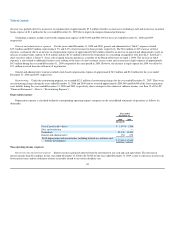
The fulfillment partner business continued to increase as percentage of total revenue in 2008. This is due to an increase in the number of non-media
products we offer on our Website. At the end of 2008, we had approximately 201,000 non-media SKUs on site compared to 63,000 at the end of 2007, a
219% increase. The fulfillment partner business accounted for 79% of total revenue during 2008 and 81% during Q4, and it grew 15% for the full year,
despite decreasing 10% in Q4 2008 as we continued to add products to existing and new categories from new and existing partners. As of December 31, 2008,
we had 1,200 fulfillment partners compared to 730 as of December 31, 2007.
Our direct business decreased 12% during the year ended December 31, 2008 compared to the prior year. As we have added partner products to our
Website, some suppliers have transitioned into fulfillment partners, eliminating the need for us to purchase their inventory, and as a result, we have
experienced a shift from direct to fulfillment partner business.
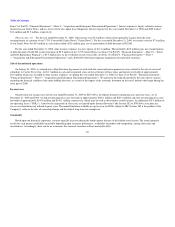
Gross profit
Our overall gross margins fluctuate based on several factors, including our sales volume mix between our direct business and fulfillment partner
business; changes in vendor and / or customer pricing, including competitive pricing, and inventory management decisions within the direct business; sales
coupons and promotions; product mix of sales; operational and fulfillment costs.
Gross margin for the year ended December 31, 2008 increased 110 basis points, from 16.3% in 2007 to 17.4% in 2008. Gross profit for the years ended
December 31, 2007 and 2008 amounted to $124.6 million and $144.2 million, respectively, a 16% increase. For the three months ended December 31, 2008,
gross profit percentage increased 80 basis points, from 15.7% in 2007 to 16.5% in
67