Overstock.com 2009 Annual Report Download - page 48
Download and view the complete annual report
Please find page 48 of the 2009 Overstock.com annual report below. You can navigate through the pages in the report by either clicking on the pages listed below, or by using the keyword search tool below to find specific information within the annual report.-
 1
1 -
2
-
3
-
4
-
5
-
6
-
7
-
8
-
9
-
10
-
11
-
12
-
13
-
14
-
15
-
16
-
17
-
18
-
19
-
20
-
21
-
22
-
23
-
24
-
25
-
26
-
27
-
28
-
29
-
30
-
31
-
32
-
33
-
34
-
35
-
36
-
37
-
 38
38 -
 39
39 -
 40
40 -
 41
41 -
 42
42 -
 43
43 -
 44
44 -
 45
45 -
 46
46 -
 47
47 -
 48
48 -
 49
49 -
 50
50 -
 51
51 -
 52
52 -
 53
53 -
 54
54 -
 55
55 -
 56
56 -
 57
57 -
 58
58 -
59
-
60
-
61
-
62
-
63
-
64
-
65
-
66
-
67
-
68
-
69
-
70
-
71
-
72
-
73
-
74
-
75
-
76
-
77
-
78
-
79
-
80
-
81
-
82
-
83
-
84
-
85
-
86
-
87
-
88
-
89
-
90
-
91
-
92
-
93
-
94
-
95
-
96
-
97
-
98
-
99
-
100
-
101
-
102
-
103
-
104
-
105
-
106
-
107
-
108
-
109
-
110
-
111
-
112
-
113
-
114
-
115
-
116
-
117
-
118
-
119
-
120
-
121
-
122
-
123
-
124
-
125
-
126
-
127
-
128
-
129
-
130
-
131
-
132
-
133
-
134
-
135
-
136
-
137
-
138
-
139
-
140
-
141
-
142
-
143
-
144
-
145
-
146
-
147
-
148
-
149
-
150
-
151
-
152
-
153
-
154
-
155
-
156
-
157
-
158
-
159
-
160
-
161
-
162
-
163
-
164
-
165
-
166
-
167
-
168
 |
 |
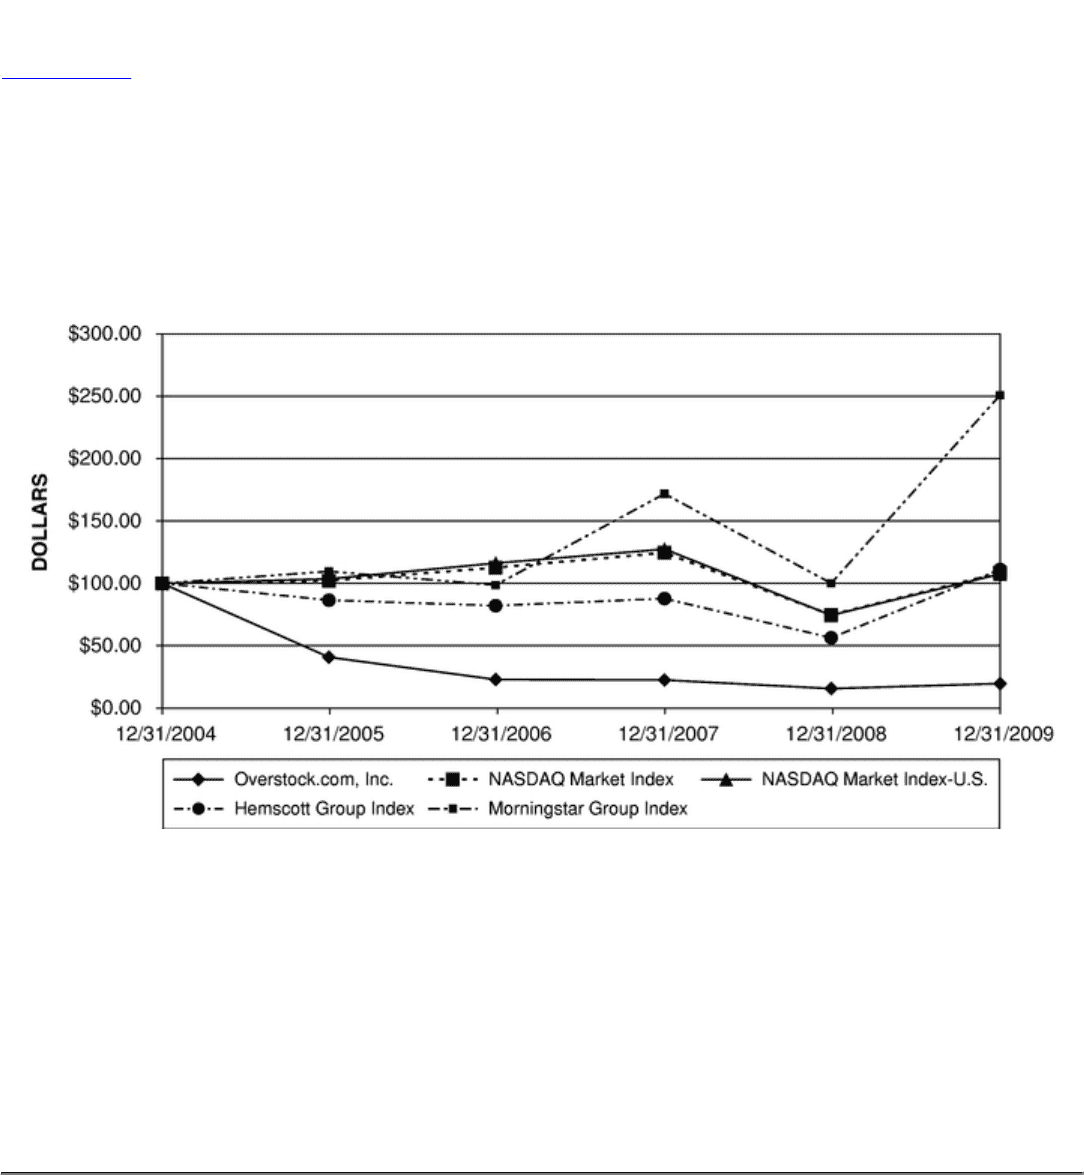
Table of Contents
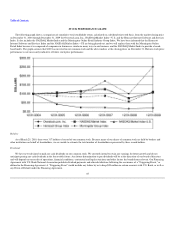
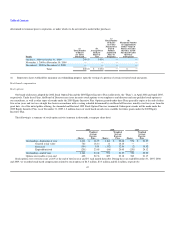
STOCK PERFORMANCE GRAPH
The following graph shows a comparison of cumulative total stockholder return, calculated on a dividend reinvested basis, from the market closing price
on December 31, 2004 through December 31, 2009 for Overstock.com, Inc., NASDAQ Market Index—U.S. and the Hemscott Internet Software and Services
Index. It also includes the NASDAQ Market Index and the Morningstar Online Retail Industry Group Index. We have been informed that the Hemscott
Internet Software and Services Index and the NASDAQ Market Index—US are being phased out, and we will replace them with the Morningstar Online
Retail Index because it is composed of companies in businesses similar in many ways to our business, and the NASDAQ Market Index to provide a broad-
based index. The graph assumes that $100 was invested in our common stock and the above indices at the closing prices on December 31. Historic stock price
performance is not necessarily indicative of future stock price performance.
Holders
As of March 25, 2010, there were 317 holders of record of our common stock. Because many of our shares of common stock are held by brokers and
other institutions on behalf of shareholders, we are unable to estimate the total number of shareholders represented by these record holders.
Dividends
We have never declared or paid any cash dividends on our common stock. We currently intend to retain any earnings for future growth and do not
anticipate paying any cash dividends in the foreseeable future. Any future determination to pay dividends will be at the discretion of our board of directors
and will depend on our results of operations, financial conditions, contractual and legal restrictions and other factors the board deems relevant. Our Financing
Agreement with U.S. Bank National Association prohibits dividend payments and other distributions following the occurrence of a "Triggering Event," as
defined in the Financing Agreement. A "Triggering Event" would include any failure by us to keep $20 million in certain accounts with U.S. Bank, as well as
any Event of Default under the Financing Agreement.
45