Overstock.com 2009 Annual Report Download - page 82
Download and view the complete annual report
Please find page 82 of the 2009 Overstock.com annual report below. You can navigate through the pages in the report by either clicking on the pages listed below, or by using the keyword search tool below to find specific information within the annual report.-
 1
1 -
2
-
3
-
4
-
5
-
6
-
7
-
8
-
9
-
10
-
11
-
12
-
13
-
14
-
15
-
16
-
17
-
18
-
19
-
20
-
21
-
22
-
23
-
24
-
25
-
26
-
27
-
28
-
29
-
30
-
31
-
32
-
33
-
34
-
35
-
36
-
37
-
38
-
39
-
40
-
41
-
42
-
43
-
44
-
45
-
46
-
47
-
48
-
49
-
50
-
51
-
52
-
53
-
54
-
55
-
56
-
57
-
58
-
59
-
60
-
61
-
62
-
63
-
64
-
65
-
66
-
67
-
68
-
69
-
70
-
71
-
 72
72 -
 73
73 -
 74
74 -
 75
75 -
 76
76 -
 77
77 -
 78
78 -
 79
79 -
 80
80 -
 81
81 -
 82
82 -
 83
83 -
 84
84 -
 85
85 -
 86
86 -
 87
87 -
 88
88 -
 89
89 -
 90
90 -
 91
91 -
 92
92 -
93
-
94
-
95
-
96
-
97
-
98
-
99
-
100
-
101
-
102
-
103
-
104
-
105
-
106
-
107
-
108
-
109
-
110
-
111
-
112
-
113
-
114
-
115
-
116
-
117
-
118
-
119
-
120
-
121
-
122
-
123
-
124
-
125
-
126
-
127
-
128
-
129
-
130
-
131
-
132
-
133
-
134
-
135
-
136
-
137
-
138
-
139
-
140
-
141
-
142
-
143
-
144
-
145
-
146
-
147
-
148
-
149
-
150
-
151
-
152
-
153
-
154
-
155
-
156
-
157
-
158
-
159
-
160
-
161
-
162
-
163
-
164
-
165
-
166
-
167
-
168
 |
 |
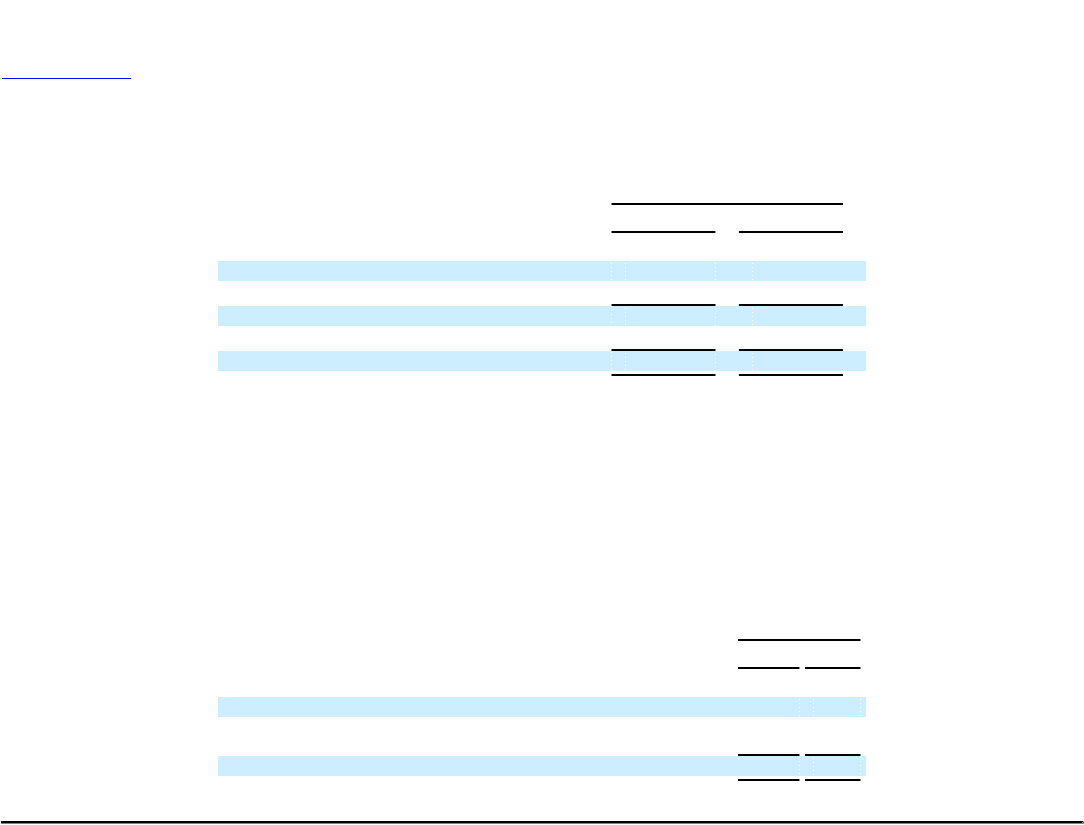
Table of Contents
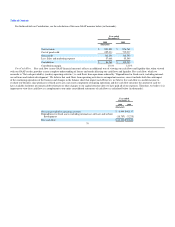
For further details on Contribution, see the calculation of this non-GAAP measure below (in thousands):
Year ended
December 31,
2008 2009
(Restated)
Total revenue $ 829,850 $ 876,769
Cost of goods sold 685,614 712,017
Gross profit 144,236 164,752
Less: Sales and marketing expense 57,668 55,549
Contribution $ 86,568 $ 109,203
Contribution margin 10.4% 12.5%
Free Cash Flow. Free cash flow (a non-GAAP financial measure) reflects an additional way of viewing our cash flows and liquidity that, when viewed
with our GAAP results, provides a more complete understanding of factors and trends affecting our cash flows and liquidity. Free cash flow, which we
reconcile to "Net cash provided by (used in) operating activities", is cash flows from operations reduced by "Expenditures for fixed assets, including internal-
use software and website development." We believe that cash flows from operating activities is an important measure, since it includes both the cash impact
of the continuing operations of the business and changes in the balance sheet that impact cash. However, we believe free cash flow is a useful measure to
evaluate our business since purchases of fixed assets are a necessary component of ongoing operations and free cash flow measures the amount of cash we
have available for future investment, debt retirement or other changes to our capital structure after we have paid all of our expenses. Therefore, we believe it is
important to view free cash flow as a complement to our entire consolidated statements of cash flows as calculated below (in thousands):
Year ended
December 31,
2008 2009
(Restated)
Net cash provided by operating activities $ 6,444 $46,117
Expenditures for fixed assets, including internal-use software and website
development (18,707) (7,275)
Free cash flow $(12,263)$38,842
79