Overstock.com 2009 Annual Report Download - page 139
Download and view the complete annual report
Please find page 139 of the 2009 Overstock.com annual report below. You can navigate through the pages in the report by either clicking on the pages listed below, or by using the keyword search tool below to find specific information within the annual report.-
 1
1 -
2
-
3
-
4
-
5
-
6
-
7
-
8
-
9
-
10
-
11
-
12
-
13
-
14
-
15
-
16
-
17
-
18
-
19
-
20
-
21
-
22
-
23
-
24
-
25
-
26
-
27
-
28
-
29
-
30
-
31
-
32
-
33
-
34
-
35
-
36
-
37
-
38
-
39
-
40
-
41
-
42
-
43
-
44
-
45
-
46
-
47
-
48
-
49
-
50
-
51
-
52
-
53
-
54
-
55
-
56
-
57
-
58
-
59
-
60
-
61
-
62
-
63
-
64
-
65
-
66
-
67
-
68
-
69
-
70
-
71
-
72
-
73
-
74
-
75
-
76
-
77
-
78
-
79
-
80
-
81
-
82
-
83
-
84
-
85
-
86
-
87
-
88
-
89
-
90
-
91
-
92
-
93
-
94
-
95
-
96
-
97
-
98
-
99
-
100
-
101
-
102
-
103
-
104
-
105
-
106
-
107
-
108
-
109
-
110
-
111
-
112
-
113
-
114
-
115
-
116
-
117
-
118
-
119
-
120
-
121
-
122
-
123
-
124
-
125
-
126
-
127
-
128
-
 129
129 -
 130
130 -
 131
131 -
 132
132 -
 133
133 -
 134
134 -
 135
135 -
 136
136 -
 137
137 -
 138
138 -
 139
139 -
 140
140 -
 141
141 -
 142
142 -
 143
143 -
 144
144 -
 145
145 -
 146
146 -
 147
147 -
 148
148 -
 149
149 -
150
-
151
-
152
-
153
-
154
-
155
-
156
-
157
-
158
-
159
-
160
-
161
-
162
-
163
-
164
-
165
-
166
-
167
-
168
 |
 |
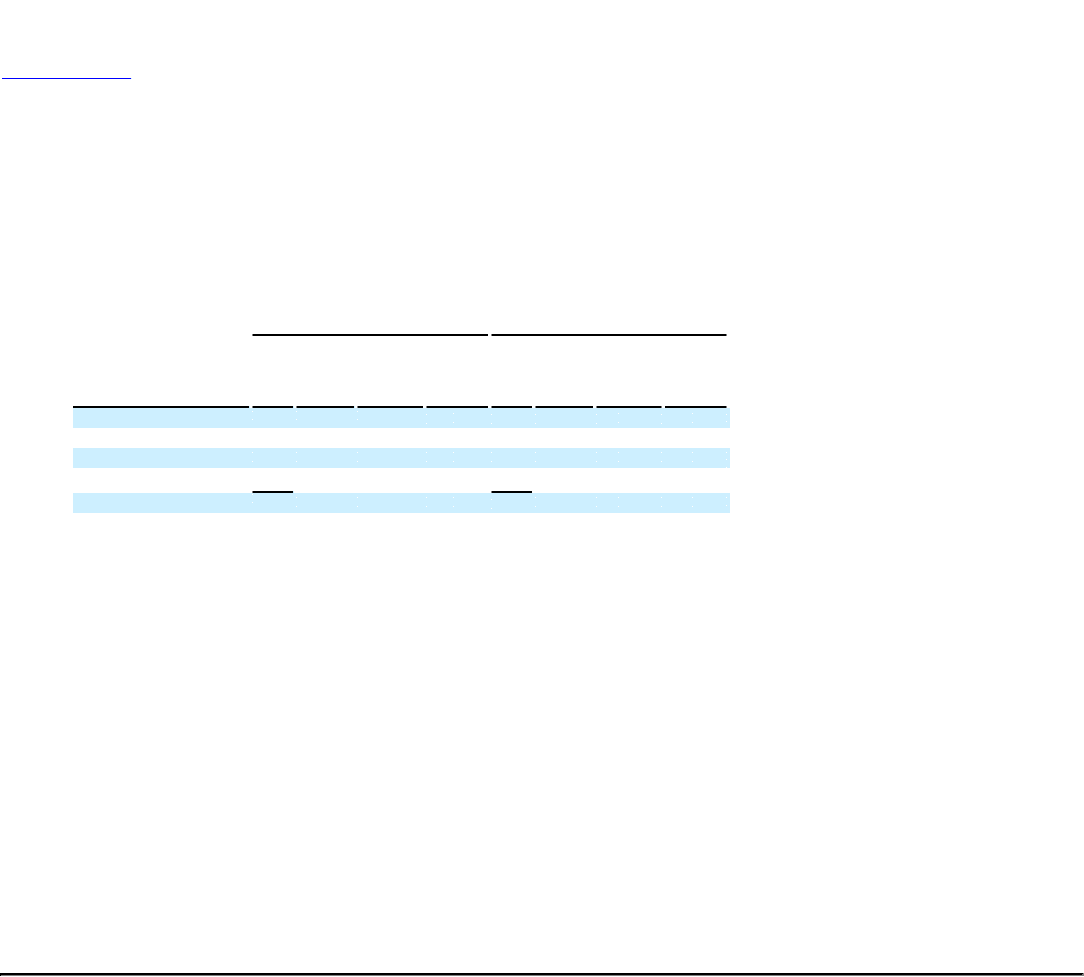
Table of Contents
Overstock.com, Inc.
Notes to Consolidated Financial Statements (Continued)
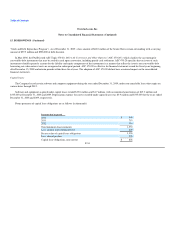
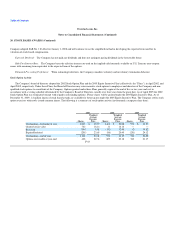
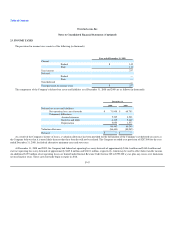
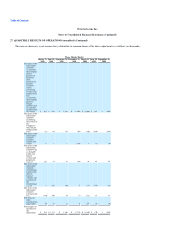
20. STOCK BASED AWARDS (Continued)
The following table summarizes information about stock options as of December 31, 2009 (in thousands, except per share data):
Options Outstanding Options Exercisable
Range of Exercise Prices Shares
Weighted
Average
Exercise
Price
Weighted
Average
Remaining
Contract
Life
Aggregate
Intrinsic
Value Shares
Weighted
Average
Exercise
Price
Weighted
Average
Remaining
Contract
Life
Aggregate
Intrinsic
Value
$ 8.50 - $16.99 16 $ 13.48 5.91 $ 19 10 $ 13.72 5.35 $ 6
$17.00 - $17.99 548 17.10 7.04 — 394 17.10 7.04 —
$18.00 - $29.99 84 22.01 2.88 — 69 22.19 2.41 —
$30.00 - $58.30 73 43.76 1.17 — 70 44.19 0.86 —
721 20.29 5.90 19 543 21.17 5.62 6
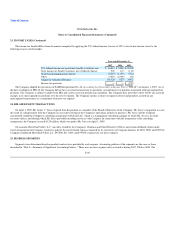
Total unrecognized compensation costs related to nonvested awards was approximately $7.3 million, $4.2 million and $1.8 million as of December 31,
2007, 2008 and 2009, respectively. These unrecognized compensation costs related to nonvested awards are expected to be recognized over the weighted
average period of 1 year.
The aggregate intrinsic value in the table above represents the total pretax intrinsic value, based on the Company's stock price of $13.56 as of
December 31, 2009, which would have been received by the option holders had all option holders exercised their options as of that date. There were 3,000 in-
the-money options exercisable as of December 31, 2009.
The weighted average exercise price of options granted during the years ended December 31, 2007 and 2008 were $18.14 and $14.14 per share,
respectively. The Company granted no options during the year ended December 31, 2009. The total intrinsic value of options exercised during the years ended
December 31, 2007, 2008 and 2009 was $4.5 million, $364,000 and $2,000, respectively. The total cash received from employees as a result of employee
stock option exercises during the years ended December 31, 2007, 2008 and 2009 were approximately $3.2 million, $1.5 million and $29,000, respectively. In
connection with these exercises, there was no tax benefit realized by the Company due to the Company's current net operating loss position.
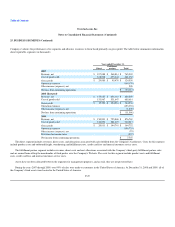
Restricted Stock Unit Activity
For the years ended December 31, 2008 and 2009, 491,000 and 366,000 restricted stock units were granted. The cost of restricted stock units is
determined using the fair value of the Company's common stock on the date of the grant and compensation expense is recognized straight-line over the three
year vesting schedule. The weighted average grant date fair value of restricted stock units granted during the year ended December 31, 2008 and 2009 was
$12.64 and $10.15.
F-44