Overstock.com 2009 Annual Report Download - page 105
Download and view the complete annual report
Please find page 105 of the 2009 Overstock.com annual report below. You can navigate through the pages in the report by either clicking on the pages listed below, or by using the keyword search tool below to find specific information within the annual report.-
 1
1 -
2
-
3
-
4
-
5
-
6
-
7
-
8
-
9
-
10
-
11
-
12
-
13
-
14
-
15
-
16
-
17
-
18
-
19
-
20
-
21
-
22
-
23
-
24
-
25
-
26
-
27
-
28
-
29
-
30
-
31
-
32
-
33
-
34
-
35
-
36
-
37
-
38
-
39
-
40
-
41
-
42
-
43
-
44
-
45
-
46
-
47
-
48
-
49
-
50
-
51
-
52
-
53
-
54
-
55
-
56
-
57
-
58
-
59
-
60
-
61
-
62
-
63
-
64
-
65
-
66
-
67
-
68
-
69
-
70
-
71
-
72
-
73
-
74
-
75
-
76
-
77
-
78
-
79
-
80
-
81
-
82
-
83
-
84
-
85
-
86
-
87
-
88
-
89
-
90
-
91
-
92
-
93
-
94
-
 95
95 -
 96
96 -
 97
97 -
 98
98 -
 99
99 -
 100
100 -
 101
101 -
 102
102 -
 103
103 -
 104
104 -
 105
105 -
 106
106 -
 107
107 -
 108
108 -
 109
109 -
 110
110 -
 111
111 -
 112
112 -
 113
113 -
 114
114 -
 115
115 -
116
-
117
-
118
-
119
-
120
-
121
-
122
-
123
-
124
-
125
-
126
-
127
-
128
-
129
-
130
-
131
-
132
-
133
-
134
-
135
-
136
-
137
-
138
-
139
-
140
-
141
-
142
-
143
-
144
-
145
-
146
-
147
-
148
-
149
-
150
-
151
-
152
-
153
-
154
-
155
-
156
-
157
-
158
-
159
-
160
-
161
-
162
-
163
-
164
-
165
-
166
-
167
-
168
 |
 |

Table of Contents
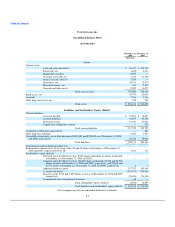
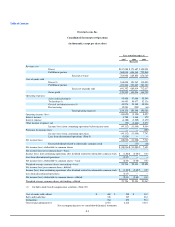
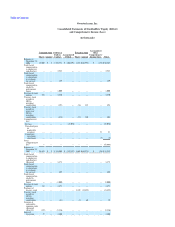
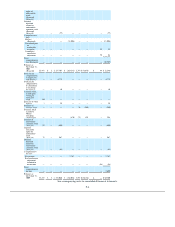
Overstock.com, Inc.
Notes to Consolidated Financial Statements (Continued)
2. ACCOUNTING POLICIES (Continued)
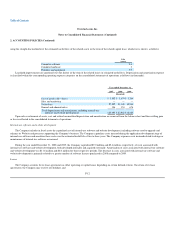
and payment history and maintains an allowance for doubtful accounts receivable based upon its historical collection experience and expected collectability of
all accounts receivable. The allowance for doubtful accounts receivable was $1.6 million and $1.7 million at December 31, 2008 and 2009, respectively.
Concentration of credit risk
Cash equivalents include short-term, highly liquid instruments with maturities at date of purchase of 90 days or less. At December 31, 2008 and 2009,
two banks held the Company's cash and cash equivalents. The Company does not believe that, as a result of this concentration, it is subject to any unusual
financial risk beyond the normal risk associated with commercial banking relationships.
Financial instruments that potentially subject the Company to significant concentrations of credit risk consist primarily of cash equivalents, investment
securities, and receivables. The Company invests its cash primarily in money market securities which are uninsured.
The Company's accounts receivable are derived primarily from revenue earned from customers located in the United States. The Company maintains an
allowance for doubtful accounts based upon the expected collectability of accounts receivable.
Inventories
Inventories, consisting of merchandise purchased for resale, are accounted for using a standard costing system which approximates the first-in-first-out
("FIFO") method of accounting, and are valued at the lower of cost or market. The Company establishes allowances for estimated obsolescence and to lower
of cost or market value based upon assumptions about future demand and market conditions. Once established, the original cost of the inventory less the
related allowance represents the new cost basis of such products. Reversal of these allowances is recognized only when the related inventory has been sold or
scrapped.
Prepaid inventory, net
Prepaid inventory represents inventory paid for in advance of receipt. Prepaid inventory at December 31, 2008 and 2009 was $761,000 and $2.9 million
respectively.
Prepaids and other assets
Prepaids and other assets represent expenses paid prior to receipt of the related goods or services, including advertising, maintenance, packaging,
insurance and other miscellaneous costs. Total prepaids and other assets at December 31, 2008 and 2009 were $9.6 million and $10.3 million, respectively.
Fixed Assets
Fixed assets, which include assets such as furniture and fixtures, technology infrastructure, internal-use software and website development, are recorded
at cost and depreciated or amortized
F-11