Overstock.com 2009 Annual Report Download - page 68
Download and view the complete annual report
Please find page 68 of the 2009 Overstock.com annual report below. You can navigate through the pages in the report by either clicking on the pages listed below, or by using the keyword search tool below to find specific information within the annual report.-
 1
1 -
2
-
3
-
4
-
5
-
6
-
7
-
8
-
9
-
10
-
11
-
12
-
13
-
14
-
15
-
16
-
17
-
18
-
19
-
20
-
21
-
22
-
23
-
24
-
25
-
26
-
27
-
28
-
29
-
30
-
31
-
32
-
33
-
34
-
35
-
36
-
37
-
38
-
39
-
40
-
41
-
42
-
43
-
44
-
45
-
46
-
47
-
48
-
49
-
50
-
51
-
52
-
53
-
54
-
55
-
56
-
57
-
 58
58 -
 59
59 -
 60
60 -
 61
61 -
 62
62 -
 63
63 -
 64
64 -
 65
65 -
 66
66 -
 67
67 -
 68
68 -
 69
69 -
 70
70 -
 71
71 -
 72
72 -
 73
73 -
 74
74 -
 75
75 -
 76
76 -
 77
77 -
 78
78 -
79
-
80
-
81
-
82
-
83
-
84
-
85
-
86
-
87
-
88
-
89
-
90
-
91
-
92
-
93
-
94
-
95
-
96
-
97
-
98
-
99
-
100
-
101
-
102
-
103
-
104
-
105
-
106
-
107
-
108
-
109
-
110
-
111
-
112
-
113
-
114
-
115
-
116
-
117
-
118
-
119
-
120
-
121
-
122
-
123
-
124
-
125
-
126
-
127
-
128
-
129
-
130
-
131
-
132
-
133
-
134
-
135
-
136
-
137
-
138
-
139
-
140
-
141
-
142
-
143
-
144
-
145
-
146
-
147
-
148
-
149
-
150
-
151
-
152
-
153
-
154
-
155
-
156
-
157
-
158
-
159
-
160
-
161
-
162
-
163
-
164
-
165
-
166
-
167
-
168
 |
 |

Table of Contents
decrease was partially offset by an increase in compensation of approximately $7.2 million related to an increase in technology staff and an increase in annual
bonus expense of $1.4 million for the year ended December 31, 2009 due to improved company financial performance.
Technology expenses include stock-based compensation expense of $870,000 and $961,000 for the years ended December 31, 2008 and 2009,
respectively.
General and administrative expenses. For the years ended December 31, 2008 and 2009, general and administrative ("G&A") expenses totaled
$39.3 million and $48.9 million, representing 4.7% and 5.6% of total revenue for those periods, respectively. The $9.6 million or 24% increase in G&A
expenses, is primarily due to an increase in compensation expense of approximately $6.0 million related to an increase in general and administrative staff, an
increase in annual bonus expense of $3.8 million and also $1.25 million related to the termination of a consulting arrangement with Icent LLC. Icent LLC's
chief executive officer is James V. Joyce, who resigned from his position as a member of the Board of Directors on April 1, 2009. The increase in G&A
expenses is also related to additional facilities costs relating to the lease of a new customer service center and an increase in legal expenses of approximately
$4.3 million during the year ended December 31, 2009 compared to the same period in 2008. However, the increase in legal expense for 2009 was offset by
$7.1 million received from the settlement of legal matters.
General and administrative expenses include stock-based compensation expense of approximately $2.2 million and $3.0 million for the years ended
December 31, 2008 and 2009, respectively.
Restructuring. Under the restructuring program, we recorded $12.3 million of restructuring charges for the year ended December 31, 2007. There were
no restructuring charges during the years ended December 31, 2008 and 2009 and we reversed approximately $299,000 and $66,000 of the lease termination
costs liability during the years ended December 31, 2008 and 2009, respectively, due to changes in the estimate of sublease income. (see Item 15 of Part IV,
"Financial Statements"—Note 4—"Restructuring Expense").
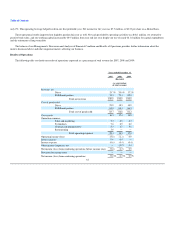
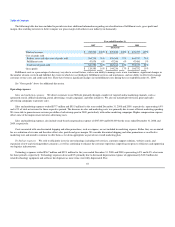
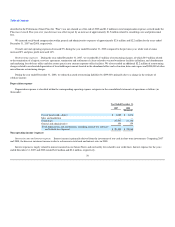
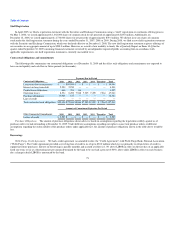
Depreciation expense
Depreciation expense is classified within the corresponding operating expense categories on the consolidated statements of operations as follows (in
thousands):
Year ended
December 31,
2008 2009
(Restated)
Cost of goods sold—direct $ 1,674 $ 1,264
Sales and marketing — —
Technology 21,140 10,943
General and administrative 154 676
Total depreciation and amortization, including internal-use software and
website development $ 22,968 $12,883
`
Non-operating income (expense)
Interest income and interest expense. Interest income is primarily derived from the investment of our cash and cash equivalents. The decrease in
interest income from $3.2 million for the year ended December 31, 2008 to $170,000 for the year ended December 31, 2009, is due to a decrease in total cash,
lower interest rates and the settlement of notes receivable related to our travel subsidiary (see
65