Overstock.com 2009 Annual Report Download - page 103
Download and view the complete annual report
Please find page 103 of the 2009 Overstock.com annual report below. You can navigate through the pages in the report by either clicking on the pages listed below, or by using the keyword search tool below to find specific information within the annual report.-
 1
1 -
2
-
3
-
4
-
5
-
6
-
7
-
8
-
9
-
10
-
11
-
12
-
13
-
14
-
15
-
16
-
17
-
18
-
19
-
20
-
21
-
22
-
23
-
24
-
25
-
26
-
27
-
28
-
29
-
30
-
31
-
32
-
33
-
34
-
35
-
36
-
37
-
38
-
39
-
40
-
41
-
42
-
43
-
44
-
45
-
46
-
47
-
48
-
49
-
50
-
51
-
52
-
53
-
54
-
55
-
56
-
57
-
58
-
59
-
60
-
61
-
62
-
63
-
64
-
65
-
66
-
67
-
68
-
69
-
70
-
71
-
72
-
73
-
74
-
75
-
76
-
77
-
78
-
79
-
80
-
81
-
82
-
83
-
84
-
85
-
86
-
87
-
88
-
89
-
90
-
91
-
92
-
 93
93 -
 94
94 -
 95
95 -
 96
96 -
 97
97 -
 98
98 -
 99
99 -
 100
100 -
 101
101 -
 102
102 -
 103
103 -
 104
104 -
 105
105 -
 106
106 -
 107
107 -
 108
108 -
 109
109 -
 110
110 -
 111
111 -
 112
112 -
 113
113 -
114
-
115
-
116
-
117
-
118
-
119
-
120
-
121
-
122
-
123
-
124
-
125
-
126
-
127
-
128
-
129
-
130
-
131
-
132
-
133
-
134
-
135
-
136
-
137
-
138
-
139
-
140
-
141
-
142
-
143
-
144
-
145
-
146
-
147
-
148
-
149
-
150
-
151
-
152
-
153
-
154
-
155
-
156
-
157
-
158
-
159
-
160
-
161
-
162
-
163
-
164
-
165
-
166
-
167
-
168
 |
 |

Table of Contents
Overstock.com, Inc.
Notes to Consolidated Financial Statements (Continued)
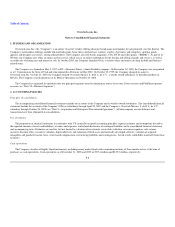
2. ACCOUNTING POLICIES (Continued)
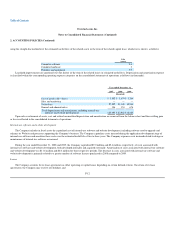
Restricted cash
The Company considers cash that is legally restricted and cash that is held as a compensating balance for letter of credit arrangements as restricted cash.
At December 31, 2008 and 2009, restricted cash was $4.3 million and $4.4 million and was held primarily in money market accounts.
Marketable securities
Marketable securities consist of funds deposited into capital management accounts at one financial institution. The Company generally invests excess
cash in short- to intermediate-term fixed income securities and money market mutual funds, including municipal, government and corporate bonds which are
classified as available-for-sale marketable securities on the consolidated balance sheets and are reported at fair value using the specific identification method.
Realized gains and losses are included in other income (expense), net in the consolidated statements of operations. Unrealized gains and losses are excluded
from earnings and reported as a component of accumulated other comprehensive income (loss), net of related tax effect.
The Company periodically evaluates whether declines in fair values of its investments are other-than-temporary. This evaluation consists of a review of
qualitative and quantitative factors, including quoted market prices, if available, other publicly available information, or other conditions that bear on the
value of its investments. At December 31, 2008, gross unrealized gains on marketable securities were $48,000. The Company recorded an "other than
temporary" impairment of marketable securities of $300,000 and realized losses of $34,000 during the year ended December 31, 2008 and realized losses of
$48,000 during the year ended December 31, 2009. The Company had no marketable securities at December 31, 2009.
Fair value of financial instruments
The Company's financial instruments, including cash, cash equivalents, notes receivable, accounts receivable, accounts payable and accrued liabilities are
carried at cost, which approximates their fair value because of the short-term maturity of these instruments.
The Company accounts for its assets using a hierarchy of valuation techniques based on whether the inputs to those valuation techniques are observable
or unobservable. Observable inputs reflect market data obtained from independent sources, while unobservable inputs reflect the Company's market
assumptions. These two types of inputs have created the following fair-value hierarchy:
Level 1—Quoted prices for identical instruments in active markets;
Level 2—Quoted prices for similar instruments in active markets, quoted prices for identical or similar instruments in markets that are not active,
and model-derived valuations in which all significant inputs and significant value drivers are observable in active markets; and
Level 3—Valuations derived from valuation techniques in which one or more significant inputs or significant value drivers are unobservable.
This hierarchy requires the Company to minimize the use of unobservable inputs and to use observable market data, if available, when determining fair
value.
F-9
•
•
•