Overstock.com 2009 Annual Report Download - page 114
Download and view the complete annual report
Please find page 114 of the 2009 Overstock.com annual report below. You can navigate through the pages in the report by either clicking on the pages listed below, or by using the keyword search tool below to find specific information within the annual report.-
 1
1 -
2
-
3
-
4
-
5
-
6
-
7
-
8
-
9
-
10
-
11
-
12
-
13
-
14
-
15
-
16
-
17
-
18
-
19
-
20
-
21
-
22
-
23
-
24
-
25
-
26
-
27
-
28
-
29
-
30
-
31
-
32
-
33
-
34
-
35
-
36
-
37
-
38
-
39
-
40
-
41
-
42
-
43
-
44
-
45
-
46
-
47
-
48
-
49
-
50
-
51
-
52
-
53
-
54
-
55
-
56
-
57
-
58
-
59
-
60
-
61
-
62
-
63
-
64
-
65
-
66
-
67
-
68
-
69
-
70
-
71
-
72
-
73
-
74
-
75
-
76
-
77
-
78
-
79
-
80
-
81
-
82
-
83
-
84
-
85
-
86
-
87
-
88
-
89
-
90
-
91
-
92
-
93
-
94
-
95
-
96
-
97
-
98
-
99
-
100
-
101
-
102
-
103
-
 104
104 -
 105
105 -
 106
106 -
 107
107 -
 108
108 -
 109
109 -
 110
110 -
 111
111 -
 112
112 -
 113
113 -
 114
114 -
 115
115 -
 116
116 -
 117
117 -
 118
118 -
 119
119 -
 120
120 -
 121
121 -
 122
122 -
 123
123 -
 124
124 -
125
-
126
-
127
-
128
-
129
-
130
-
131
-
132
-
133
-
134
-
135
-
136
-
137
-
138
-
139
-
140
-
141
-
142
-
143
-
144
-
145
-
146
-
147
-
148
-
149
-
150
-
151
-
152
-
153
-
154
-
155
-
156
-
157
-
158
-
159
-
160
-
161
-
162
-
163
-
164
-
165
-
166
-
167
-
168
 |
 |

Table of Contents
Overstock.com, Inc.
Notes to Consolidated Financial Statements (Continued)
2. ACCOUNTING POLICIES (Continued)
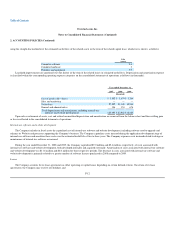
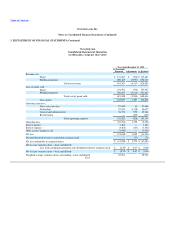
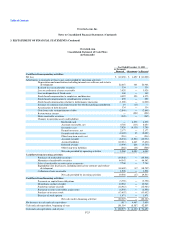
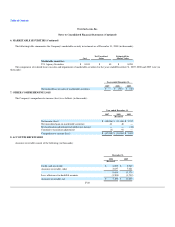
The following table sets forth the computation of basic and diluted net income (loss) per common share for the periods indicated (in thousands, except
per share data):
Year ended December 31,
2007 2008 2009
(Restated)
Income (loss) from continuing operations $ (44,112)$ (11,006)$ 7,747
Deemed dividend related to redeemable common stock — (77) (48)
Income (loss) from continuing operations attributable to common shares $ (44,112)$ (11,083)$ 7,699
Loss from discontinued operations (3,924) — —
Net income (loss) attributable to common shares $ (48,036)$ (11,083)$ 7,699
Weighted average common shares outstanding—basic 23,704 22,901 22,821
Effect of dilutive securities:
Stock options and restricted stock units — — 246
Convertible senior notes — — —
Weighted average common shares outstanding—diluted 23,704 22,901 23,067
Net income (loss) per common share—basic:
Income (loss) from continuing operations after dividend related to common stock $ (1.86)$ (0.48)$ 0.34
Loss from discontinued operations $ (0.17)$ — $ —
Net income (loss) per common share—basic $ (2.03)$ (0.48)$ 0.34
Net income (loss) per common share—diluted:
Income (loss) from continuing operations after dividend related to common stock $ (1.86)$ (0.48)$ 0.33
Loss from discontinued operations $ (0.17)$ — $ —
Net income (loss) per common share—diluted $ (2.03)$ (0.48)$ 0.33
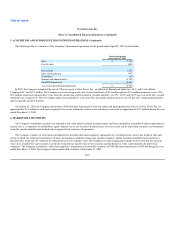
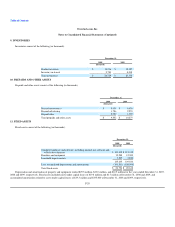
The following shares were excluded from the calculation of diluted weighted average shares outstanding as their effect would have been anti-dilutive (in
thousands):
Year ended
December 31,
2007 2008 2009
Stock options and restricted stock units 1,200 1,423 740
Performance share plan 376 — —
Convertible senior notes 1,010 885 787
Accounting pronouncements issued not yet adopted
In October 2009, the FASB issued Accounting Standards Update 2009-13 ("ASU 2009-13"), which amends ASC Topic 605, Revenue Recognition, to
require companies to allocate revenue in multiple-element arrangements based on an element's estimated selling price if vendor-specific or other third-party
evidence of value is not available. ASU 2009-13 is effective beginning January 1, 2011. Earlier
F-20