Overstock.com 2009 Annual Report Download - page 123
Download and view the complete annual report
Please find page 123 of the 2009 Overstock.com annual report below. You can navigate through the pages in the report by either clicking on the pages listed below, or by using the keyword search tool below to find specific information within the annual report.-
 1
1 -
 2
2 -
 3
3 -
 4
4 -
 5
5 -
 6
6 -
 7
7 -
 8
8 -
 9
9 -
 10
10 -
 11
11 -
 12
12 -
 13
13 -
 14
14 -
 15
15 -
 16
16 -
 17
17 -
 18
18 -
 19
19 -
 20
20 -
 21
21 -
 22
22 -
 23
23 -
 24
24 -
 25
25 -
 26
26 -
 27
27 -
 28
28 -
 29
29 -
 30
30 -
 31
31 -
 32
32 -
 33
33 -
 34
34 -
 35
35 -
 36
36 -
 37
37 -
 38
38 -
 39
39 -
 40
40 -
 41
41 -
 42
42 -
 43
43 -
 44
44 -
 45
45 -
 46
46 -
 47
47 -
 48
48 -
 49
49 -
 50
50 -
 51
51 -
 52
52 -
 53
53 -
 54
54 -
 55
55 -
 56
56 -
 57
57 -
 58
58 -
 59
59 -
 60
60 -
 61
61 -
 62
62 -
 63
63 -
 64
64 -
 65
65 -
 66
66 -
 67
67 -
 68
68 -
 69
69 -
 70
70 -
 71
71 -
 72
72 -
 73
73 -
 74
74 -
 75
75 -
 76
76 -
 77
77 -
 78
78 -
 79
79 -
 80
80 -
 81
81 -
 82
82 -
 83
83 -
 84
84 -
 85
85 -
 86
86 -
 87
87 -
 88
88 -
 89
89 -
 90
90 -
 91
91 -
 92
92 -
 93
93 -
 94
94 -
 95
95 -
 96
96 -
 97
97 -
 98
98 -
 99
99 -
 100
100 -
 101
101 -
 102
102 -
 103
103 -
 104
104 -
 105
105 -
 106
106 -
 107
107 -
 108
108 -
 109
109 -
 110
110 -
 111
111 -
 112
112 -
 113
113 -
 114
114 -
 115
115 -
 116
116 -
 117
117 -
 118
118 -
 119
119 -
 120
120 -
 121
121 -
 122
122 -
 123
123 -
 124
124 -
 125
125 -
 126
126 -
 127
127 -
 128
128 -
 129
129 -
 130
130 -
 131
131 -
 132
132 -
 133
133 -
 134
134 -
 135
135 -
 136
136 -
 137
137 -
 138
138 -
 139
139 -
 140
140 -
 141
141 -
 142
142 -
 143
143 -
 144
144 -
 145
145 -
 146
146 -
 147
147 -
 148
148 -
 149
149 -
 150
150 -
 151
151 -
 152
152 -
 153
153 -
 154
154 -
 155
155 -
 156
156 -
 157
157 -
 158
158 -
 159
159 -
 160
160 -
 161
161 -
 162
162 -
 163
163 -
 164
164 -
 165
165 -
 166
166 -
 167
167 -
 168
168
 |
 |

Table of Contents
Overstock.com, Inc.
Notes to Consolidated Financial Statements (Continued)
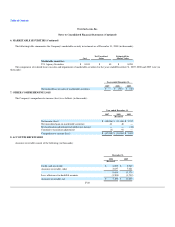
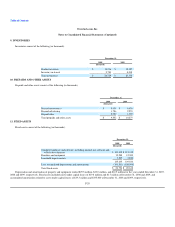
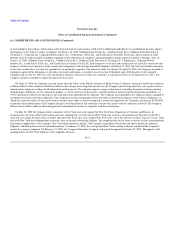
6. MARKETABLE SECURITIES (Continued)
The following table summarizes the Company's marketable security investments as of December 31, 2008 (in thousands):
Cost Net Unrealized
Gains Estimated Fair
Market Value
Marketable securities:
U.S. Agency Securities $ 8,941 $ 48 $ 8,989
The components of realized losses on sales and impairment of marketable securities for the years ended December 31, 2007, 2008 and 2009 were (in
thousands):
Years ended December 31,
2007 2008 2009
Net realized loss on sales of marketable securities $ — $ (334) $ (48)
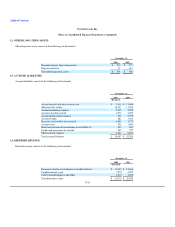
7. OTHER COMPREHENSIVE LOSS
The Company's comprehensive income (loss) is as follows (in thousands):
Year ended December 31,
2007 2008 2009
(Restated)
Net income (loss) $ (48,036) $ (11,006) $ 7,747
Net unrealized gain on marketable securities 41 48 —
Reclassification adjustment included in net income — — (48)
Cumulative translation adjustment (3) 94 —
Comprehensive income (loss) $ (47,998) $ (10,864) $ 7,699
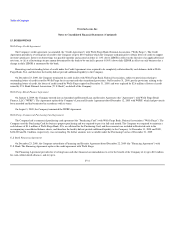
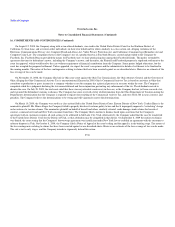
8. ACCOUNTS RECEIVABLE
Accounts receivable consist of the following (in thousands):
December 31,
2008 2009
(Restated)
Credit card receivable $ 4,057 $ 5,949
Accounts receivable, other 4,637 7,421
8,694 13,370
Less: allowance for doubtful accounts (1,594) (1,730)
Accounts receivable, net $ 7,100 $ 11,640
F-28
