Overstock.com 2009 Annual Report Download - page 64
Download and view the complete annual report
Please find page 64 of the 2009 Overstock.com annual report below. You can navigate through the pages in the report by either clicking on the pages listed below, or by using the keyword search tool below to find specific information within the annual report.-
 1
1 -
2
-
3
-
4
-
5
-
6
-
7
-
8
-
9
-
10
-
11
-
12
-
13
-
14
-
15
-
16
-
17
-
18
-
19
-
20
-
21
-
22
-
23
-
24
-
25
-
26
-
27
-
28
-
29
-
30
-
31
-
32
-
33
-
34
-
35
-
36
-
37
-
38
-
39
-
40
-
41
-
42
-
43
-
44
-
45
-
46
-
47
-
48
-
49
-
50
-
51
-
52
-
53
-
 54
54 -
 55
55 -
 56
56 -
 57
57 -
 58
58 -
 59
59 -
 60
60 -
 61
61 -
 62
62 -
 63
63 -
 64
64 -
 65
65 -
 66
66 -
 67
67 -
 68
68 -
 69
69 -
 70
70 -
 71
71 -
 72
72 -
 73
73 -
 74
74 -
75
-
76
-
77
-
78
-
79
-
80
-
81
-
82
-
83
-
84
-
85
-
86
-
87
-
88
-
89
-
90
-
91
-
92
-
93
-
94
-
95
-
96
-
97
-
98
-
99
-
100
-
101
-
102
-
103
-
104
-
105
-
106
-
107
-
108
-
109
-
110
-
111
-
112
-
113
-
114
-
115
-
116
-
117
-
118
-
119
-
120
-
121
-
122
-
123
-
124
-
125
-
126
-
127
-
128
-
129
-
130
-
131
-
132
-
133
-
134
-
135
-
136
-
137
-
138
-
139
-
140
-
141
-
142
-
143
-
144
-
145
-
146
-
147
-
148
-
149
-
150
-
151
-
152
-
153
-
154
-
155
-
156
-
157
-
158
-
159
-
160
-
161
-
162
-
163
-
164
-
165
-
166
-
167
-
168
 |
 |
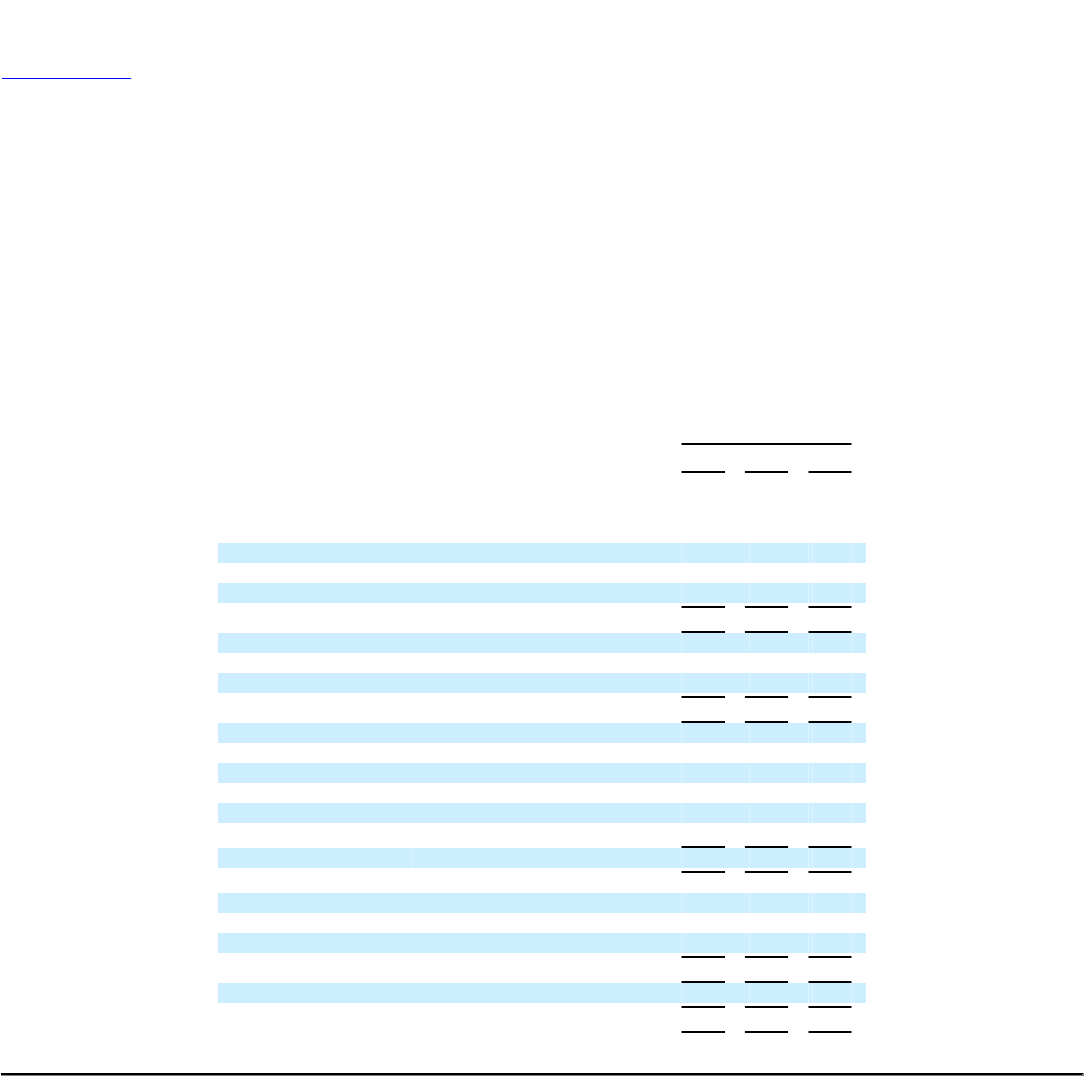
Table of Contents
only 2%. This operating leverage helped result in our first profitable year. Net income for the year was $7.7 million, or $0.33 per share on a diluted basis.
These operational results improved our liquidity position this year as well. Net cash provided by operating activities was $46.1 million, we returned to
positive book value, and our working capital increased by $9.5 million from year end last year despite our use of nearly $11.8 million for capital expenditures
and the retirement of long-term debt.
The balance of our Management's Discussion and Analysis of Financial Condition and Results of Operations provides further information about the
matters discussed above and other important matters affecting our business.
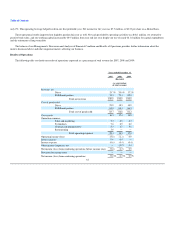
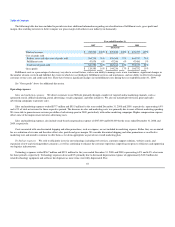
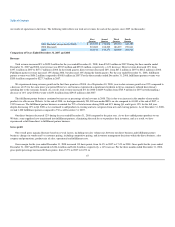
Results of Operations
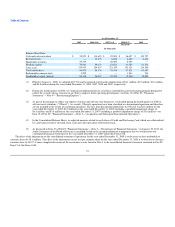
The following table sets forth our results of operations expressed as a percentage of total revenue for 2007, 2008 and 2009:
Years ended December 31
2007 2008 2009
(Restated)
(as a percentage
of total revenue)
Revenue, net
Direct 25.7% 20.9% 17.2%
Fulfillment partner 74.3 79.1 82.8
Total net revenue 100.0 100.0 100.0
Cost of goods sold
Direct 21.9 18.5 14.9
Fulfillment partner 61.8 64.1 66.3
Total cost of goods sold 83.7 82.6 81.2
Gross profit 16.3 17.4 18.8
Operating expenses:
Sales and marketing 7.2 6.9 6.3
Technology 7.8 6.9 6.0
General and administrative 5.5 4.7 5.6
Restructuring 1.6 — —
Total operating expenses 22.1 18.5 17.9
Operating income (loss) (5.8) (1.1) 0.9
Interest income 0.6 0.4 —
Interest expense (0.6) (0.4) (0.4)
Other income (expense), net — (0.2) 0.4
Net income (loss) from continuing operations before income taxes (5.8) (1.3) 0.9
Provision for income taxes — — —
Net income (loss) from continuing operations (5.8)% (1.3)% 0.9%
61