Overstock.com 2009 Annual Report Download - page 71
Download and view the complete annual report
Please find page 71 of the 2009 Overstock.com annual report below. You can navigate through the pages in the report by either clicking on the pages listed below, or by using the keyword search tool below to find specific information within the annual report.-
 1
1 -
2
-
3
-
4
-
5
-
6
-
7
-
8
-
9
-
10
-
11
-
12
-
13
-
14
-
15
-
16
-
17
-
18
-
19
-
20
-
21
-
22
-
23
-
24
-
25
-
26
-
27
-
28
-
29
-
30
-
31
-
32
-
33
-
34
-
35
-
36
-
37
-
38
-
39
-
40
-
41
-
42
-
43
-
44
-
45
-
46
-
47
-
48
-
49
-
50
-
51
-
52
-
53
-
54
-
55
-
56
-
57
-
58
-
59
-
60
-
 61
61 -
 62
62 -
 63
63 -
 64
64 -
 65
65 -
 66
66 -
 67
67 -
 68
68 -
 69
69 -
 70
70 -
 71
71 -
 72
72 -
 73
73 -
 74
74 -
 75
75 -
 76
76 -
 77
77 -
 78
78 -
 79
79 -
 80
80 -
 81
81 -
82
-
83
-
84
-
85
-
86
-
87
-
88
-
89
-
90
-
91
-
92
-
93
-
94
-
95
-
96
-
97
-
98
-
99
-
100
-
101
-
102
-
103
-
104
-
105
-
106
-
107
-
108
-
109
-
110
-
111
-
112
-
113
-
114
-
115
-
116
-
117
-
118
-
119
-
120
-
121
-
122
-
123
-
124
-
125
-
126
-
127
-
128
-
129
-
130
-
131
-
132
-
133
-
134
-
135
-
136
-
137
-
138
-
139
-
140
-
141
-
142
-
143
-
144
-
145
-
146
-
147
-
148
-
149
-
150
-
151
-
152
-
153
-
154
-
155
-
156
-
157
-
158
-
159
-
160
-
161
-
162
-
163
-
164
-
165
-
166
-
167
-
168
 |
 |

Table of Contents
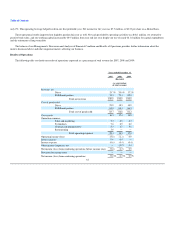
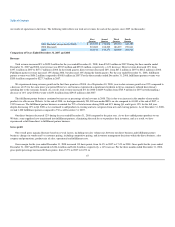
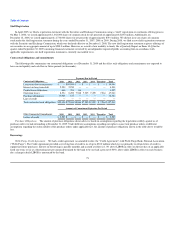
2008, and gross profit decreased 9% from $46.4 million in Q4 2007 to $42.0 million in Q4 2008. Gross profit percentages for the quarters and fiscal years
during 2007 and 2008 were:
Q1
2007 Q2
2007 Q3
2007 Q4
2007 FY
2007 Q1 2008 Q2 2008 Q3 2008 Q4 2008 FY 2008
(Restated)
(Restated)
(Restated)
(Restated)
(Restated)
Direct 11.7% 16.5% 15.3% 15.4% 14.8% 13.5% 12.5% 10.4% 8.8% 11.4%
Fulfillment
Partner 16.6% 18.0% 17.7% 15.8% 16.8% 18.4% 19.7% 19.7% 18.3% 19.0%
Combined 15.2% 17.6% 17.1% 15.7% 16.3% 17.2% 18.2% 18.0% 16.5% 17.4%
The improvement in gross margin was primarily due to increased revenues and supply chain efficiencies during 2008. The other factors described above
did not have a significant impact on the change in gross profit.
During 2008, we discovered that we had underbilled our fulfillment partners for certain fees and charges related to returns during the years ended
December 31, 2007 and 2008, due to a systems issue. Of the total $5.5 million underbilling, $2.8 million related to the year ended December 31, 2007 and
$2.7 million related to the year ended December 31, 2008.
We contacted the affected fulfillment partners and in our negotiations with them over several months, we agreed to forgive the $2.8 million related to the
2007 amounts and to seek to recover the $2.7 million related to 2008 over time from our future sales of the fulfillment partners' products during the remainder
of 2008 and 2009. As a result of the negotiations we later agreed to forgive an additional $375,000. We recovered a total of $2.3 million through
December 31, 2009, including $1.8 million during the three months ended December 31, 2008 and $615,000 during the year ended December 31, 2009. We
have recorded the amounts recovered related to 2008 in the period that they originated. See Note 3 of the financial statements (see Item 15 of Part IV,
"Financial Statements"—Note 3—"Restatement of Financial Statements") for additional information.
Cost of goods sold includes stock-based compensation of $460,000 and $198,000 for the years ended December 31, 2007 and 2008, respectively.
Direct Gross Profit—Gross profit for our direct business declined 32% from $29.1 million during the year ended December 31, 2007 to $19.7 million for
the same period in 2008. Gross profit for our direct business as a percentage of direct revenue decreased from 14.8% in 2007 to 11.4% in 2008. For the three-
month periods ended December 31, 2007 and 2008, gross profit for our direct business totaled $10.4 million and $4.3 million, respectively, a 59% decrease.
Gross margin for our direct business for those three-month periods decreased from 15.4% in 2007 to 8.8% in 2008. Gross margin for our direct business
decreased along with a decrease in direct revenue of 12% for the year ended December 31, 2008, decreasing 28% for the fourth quarter of 2008 compared to
the respective periods in 2007. While fulfillment costs continue to improve, these benefits are more than offset by our fixed warehouse cost being amortized
over a smaller direct revenue base.
Fulfillment Partner Gross Profit—Our fulfillment partner business generated gross profit of $95.5 million and $124.5 million for the years ended
December 31, 2007 and 2008, respectively, a 30% improvement. Gross margin for the fulfillment partner business also increased from 16.8% in 2007 to
19.0% in 2008 for those respective periods. The increase in gross profit dollars for our fulfillment partner business is the result of the 15% increase in
fulfillment partner revenue combined with increased gross profit percentage.
Fulfillment costs
Fulfillment costs include all warehousing costs, including fixed overhead and variable handling costs (excluding packaging costs), as well as credit card
fees and customer service costs, all of which we include as costs in calculating gross profit percentage. We believe that some companies in our industry,
including some of our competitors, account for fulfillment costs within operating expenses, and
68