Overstock.com 2009 Annual Report Download - page 144
Download and view the complete annual report
Please find page 144 of the 2009 Overstock.com annual report below. You can navigate through the pages in the report by either clicking on the pages listed below, or by using the keyword search tool below to find specific information within the annual report.-
 1
1 -
2
-
3
-
4
-
5
-
6
-
7
-
8
-
9
-
10
-
11
-
12
-
13
-
14
-
15
-
16
-
17
-
18
-
19
-
20
-
21
-
22
-
23
-
24
-
25
-
26
-
27
-
28
-
29
-
30
-
31
-
32
-
33
-
34
-
35
-
36
-
37
-
38
-
39
-
40
-
41
-
42
-
43
-
44
-
45
-
46
-
47
-
48
-
49
-
50
-
51
-
52
-
53
-
54
-
55
-
56
-
57
-
58
-
59
-
60
-
61
-
62
-
63
-
64
-
65
-
66
-
67
-
68
-
69
-
70
-
71
-
72
-
73
-
74
-
75
-
76
-
77
-
78
-
79
-
80
-
81
-
82
-
83
-
84
-
85
-
86
-
87
-
88
-
89
-
90
-
91
-
92
-
93
-
94
-
95
-
96
-
97
-
98
-
99
-
100
-
101
-
102
-
103
-
104
-
105
-
106
-
107
-
108
-
109
-
110
-
111
-
112
-
113
-
114
-
115
-
116
-
117
-
118
-
119
-
120
-
121
-
122
-
123
-
124
-
125
-
126
-
127
-
128
-
129
-
130
-
131
-
132
-
133
-
 134
134 -
 135
135 -
 136
136 -
 137
137 -
 138
138 -
 139
139 -
 140
140 -
 141
141 -
 142
142 -
 143
143 -
 144
144 -
 145
145 -
 146
146 -
 147
147 -
 148
148 -
 149
149 -
 150
150 -
 151
151 -
 152
152 -
 153
153 -
 154
154 -
155
-
156
-
157
-
158
-
159
-
160
-
161
-
162
-
163
-
164
-
165
-
166
-
167
-
168
 |
 |

Table of Contents
Overstock.com, Inc.
Notes to Consolidated Financial Statements (Continued)
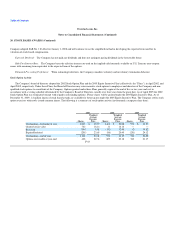
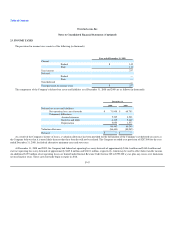
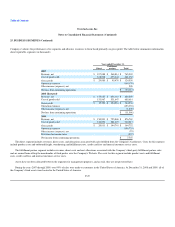
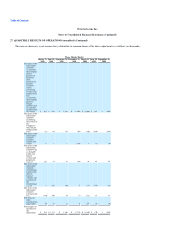
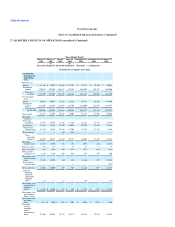
25. BUSINESS SEGMENTS (Continued)
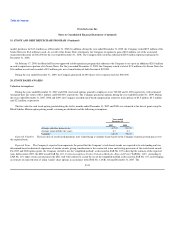
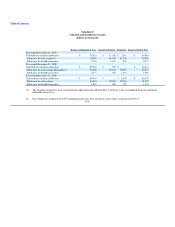
Company evaluates the performance of its segments and allocates resources to them based primarily on gross profit. The table below summarizes information
about reportable segments (in thousands):
Years ended December 31,
Direct Fulfillment
partner Total
2007
Revenue, net $ 197,088 $ 568,814 $ 765,902
Cost of goods sold 168,008 473,344 641,352
Gross profit $ 29,080 $ 95,470 $ 124,550
Operating expenses (169,170)
Other income (expense), net 508
Net loss from continuing operations $ (44,112)
2008 (Restated)
Revenue, net $ 173,687 $ 656,163 $ 829,850
Cost of goods sold 153,967 531,647 685,614
Gross profit $ 19,720 $ 124,516 $ 144,236
Operating expenses (153,394)
Other income (expense), net (1,848)
Net loss from continuing operations $ (11,006)
2009
Revenue, net $ 150,901 $ 725,868 $ 876,769
Cost of goods sold 130,890 581,127 712,017
Gross profit $ 20,011 $ 144,741 $ 164,752
Operating expenses (156,725)
Other income (expense), net (23)
Provision for income taxes (257)
Net income from continuing operations $ 7,747
The direct segment includes revenues, direct costs, and allocations associated with sales fulfilled from the Company's warehouses. Costs for this segment
include product costs and outbound freight, warehousing and fulfillment costs, credit card fees and internal customer service costs.
The fulfillment partner segment includes revenues, direct costs and cost allocations associated with the Company's third-party fulfillment partner sales
and are earned from selling the merchandise of third parties over the Company's Website. The costs for this segment include product costs and fulfillment
costs, credit card fees and internal customer service costs.
Assets have not been allocated between the segments for management purposes, and as such, they are not presented here.
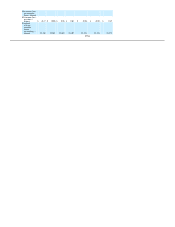
During the years 2007 through 2009, over 99% of sales were made to customers in the United States of America. At December 31, 2008 and 2009, all of
the Company's fixed assets were located in the United States of America.
F-49